Abstract
Risk-taking is a broad field of research with nuanced topics such as propensity, tendency, attitudes, preferences, aversion, perception, and appraisal. Some areas have been studied more than others. Research into the behavioral link to risk-taking falls under risk-taking tendency. In the behavioral realm, risk-taking that is potentially harmful to humans has been researched more. The BART methodology is a revolutionary tool in measuring risk-taking that involves rewarding participants for specific tasks and baiting them to take more risks with the potential for more reward but with an increased risk of loss. Extraversion is a human personality theory that categorizes humans as either extroverts or introverts. This experiment aimed to investigate whether extraversion correlates with risk-taking tendency. For research purposes, the null hypothesis is that extraversion does not correlate with risk-taking tendency. The idea is intuitive, since extroverts are believed to be more vibrant than introverts are. However, the study shows that the two variables are not statistically significantly correlated thus sustaining the null hypothesis.
Introduction
Many tools have been developed over the years in the field of research on risk-taking. The variety provides researchers with a multitude of ways to validate their hypotheses. Pioneering research in the field pointed to the fact that there are flaws in risk-taking measurement. Bran & Vaidis (2020) report about how Slovic (1964) failed to demonstrate convergent evidence on the instruments that existed at the time; he highlighted issues with these tools such as the absence of emotional arousal caused by the measures or failure to consider the subjective and context-specific nature of risk. Risk-taking research is a broad field with subsets such as risk-taking propensity, tendency, attitudes, preferences, aversion, perception, and appraisal (Bran & Vaidis, 2020). This nuance in the arena of risk-taking can cause confusion and ambiguity, and it is upon the researcher to state specifically that which they are researching. Typically, measures of risky behaviors measured from a single task are put in the risk-taking tendency category, such as Lejuez et al. (2002).
Risk-taking behaviors are defined as those that are accompanied by a degree of potential harm but offer an opportunity for gain. There is a wide range of behaviors that come with the potential for harm, but those that involve health risks such as STDs have been over-emphasized in the scientific literature (Lejuez et al., 2002). A lot of focus has been placed on the development of accurate and reliable approaches for measuring risk-taking behavior to counter this phenomenon of negative outcomes associated with risk-taking. Among the most used methodologies in measuring risk-taking behavior include self-report tools that measure parameters such as sensation-seeking, venturesomeness, impulsivity, and behavioral constraint deficits (Lejuez et al., 2002). These parameters may provide some insights but are not all-encompassing and have many limitations. One limitation of self-reporting is the veracity of the information since individuals may not be comfortable reporting their own behavior. Another weakness is that questions in the surveys typically inquire about a specific behavior that may not be useful in predicting new risk behaviors.
This study involves using a modified version of the Balloon Analogue Risk Task (BART) experiment, a computerized lab-based methodology where simulation of real-life risky behavior tendency is measured through a reward system (Lejuez et al., 2002). The risk behavior is rewarded until a specific point when it becomes counterproductive. In a bid to overcome the weakness of veracity, it was hypothesized that BART riskiness would be significantly positively correlated with self-reported risk constructs such as sensation seeking, impulsivity, and behavioral constraint deficits.
Methodology
Participants
There were 203 participants in the study, of which 36 were males, and females were 167. They were aged between 17 and 26 and were all college students recruited through advertisement. Out of these numbers, there was one 1year-old, two 18-year-olds, while those aged 19 were 37. Seventy-seven of the participants were aged 20 years, while those aged 21 years were 48 in number. Moreover, 22 participants were aged 22 years while only three were aged 23 years; 6 participants were aged 24. Finally, the frequency for 25 and 26 years was 1.
Materials and Design
The materials that were used in the experiment were the BART and a self-report form. The battery session took approximately 1.5 hours to complete and took place in a private chamber. The experiment was conducted with a modern computer as the participants sat in the adjacent room with all the instruments. A computer screen presented the BART, which consisted of a small balloon that came with a balloon pump with a “collect $” label. There was a label on the screen displaying total earned money. The balloon would get inflated with a click on the pump, which also added 5 cents in a temporary “bank.” A balloon would explode if pressed past its limit, and all the money in the reserve would disappear, and a new uninflated balloon would appear. The participant was free to stop pumping the balloon and collect the money by clicking a button that transferred the temporary money to a permanent bank. Each participant had 90 balloons total, which were color-coded depending on the probability of exploding.
The other variables in the experiment were measured using the Big 5 Inventory technique for measuring personality. The five personality traits are extroversion (also extraversion), openness, agreeableness, neuroticism, and conscientiousness. Extraversion also has facets such as gregariousness, activity, assertiveness, excitement, warmth, and positive emotions. The test would typically be performed using a questionnaire whose results are then analyzed to classify a person as either introverted or extroverted based on their score. In this experiment, 104 participants had scores of 8 to 21 and were classified as introverts, while the rest had scores above 21 and were classified as extroverts.
Procedure
The procedure involved contacting the participants who volunteered for the experiment. They would be asked their age, and the experiment would be broken down to them, after which a session would be arranged. During the session, instructions would be repeated thoroughly, and the BART would be demonstrated. The instructions were that the participant has been presented with 90 balloons and could use a button to press while collecting coins but had to be careful not to explode it lest it explodes and the temporary bank emptied. The participant had the freedom to pump the balloon as much as they wanted, and this was the measure of risk-tendency. Once the participant agreed that they understood the instrument, they would be allowed to start the experiment.
Results
Descriptive Statistics
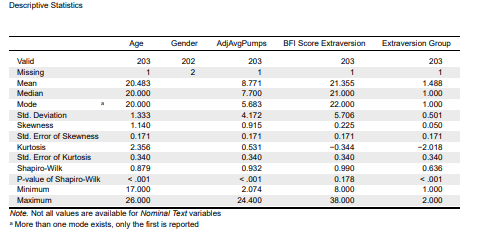
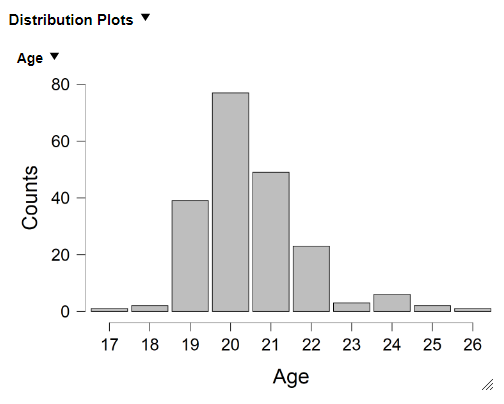
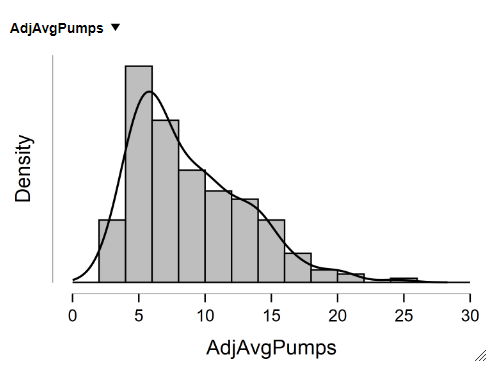
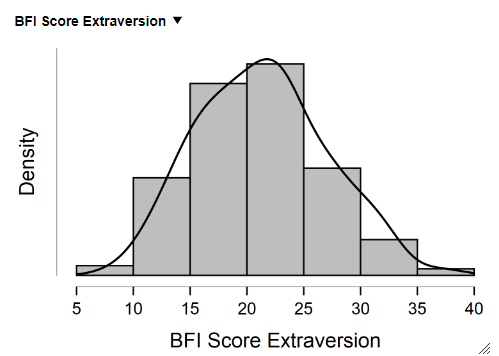
Figure 1 above shows the descriptive statistics of the variables. The variables have been calculated using JASP software. It can be seen that the variable age had mean, median, and mode of 20.483, 20, and 20 indicating symmetry of distribution since the three are close to each other. For the variable AdjAvgPumps, the mean, median, and mode were 8.77, 7.77, and 5.683; mean and median are not dramatically far from each other, also indicating negligible skewness. BFI Score extraversion score was also not dramatically skewed since the mean, median, and mode were 21.355, 21, and 22. The histogram for age indicates a symmetrical distribution with only slightly right-tailed. The histogram for AdjAvgPumps is right-skewed, with the tallest bins slightly on the left. The histogram for BFI Score Extraversion is symmetrically distributed. The descriptive statistics and histograms indicate that the variables are normally distributed and therefore qualify for analysis through parametric methods.
Independent Sample t-Test
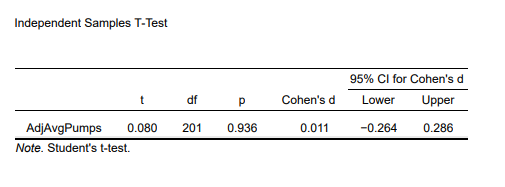
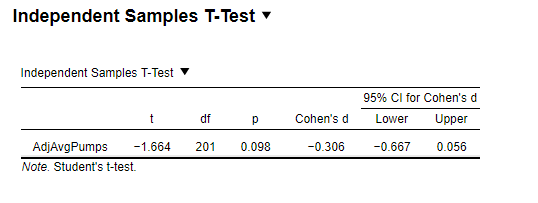
The above result in Figure 5 indicates an independent sample t-test for the variable AdjAvgPumps with the extraversion group as the grouping variable. The null hypothesis assumed that the difference between the two means was zero. An alpha of 0.05 was used, with the results showing that the experiment was not significant. This means that the two variables were not significantly different. In Figure 6, the independent sample t-test is for AdjAvgPumps variable with gender as the splitting variable. The null hypothesis is that the means of the two variables are the same. The results indicate that the two are indeed not significantly different, and the null hypothesis is sustained.
Correlation Analysis
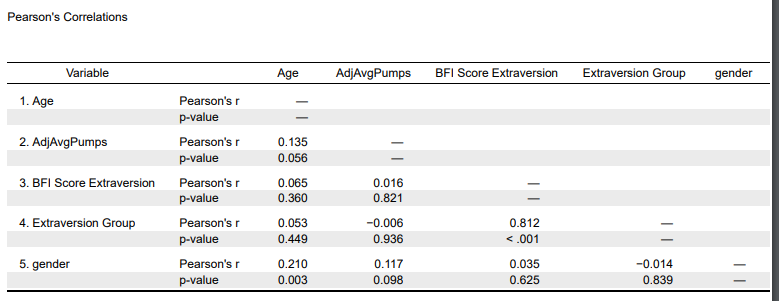
The above table shows a correlation analysis pairwise between all the variables. Pearson correlation coefficient values between -1 and 1 with the values -1 and 1 indicating strong correlation while zero indicating no correlation. The results suggest that none of the variables of interest have a statistically significant correlation based on the p-values. Age and AdjAvgPumps come close to significance at 0.056 but still miss the threshold.
Linear Regression
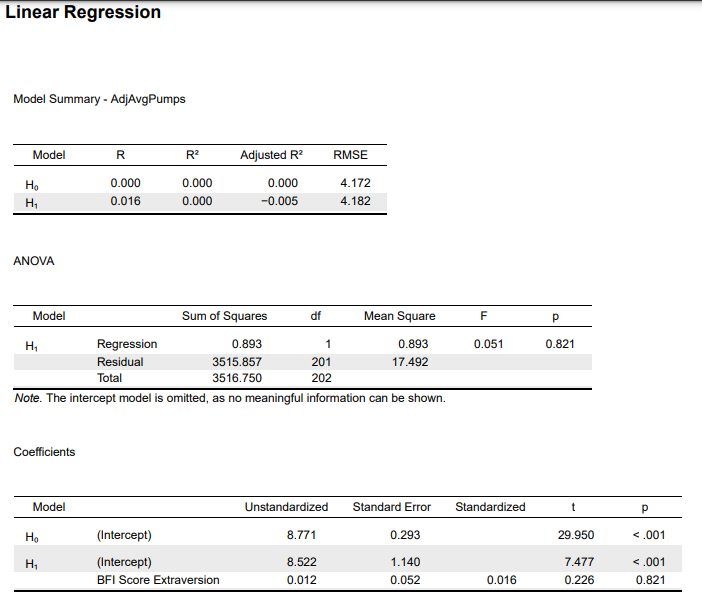
Finally, a multiple regression analysis is carried out between the variables with AdjAvgPumps as the dependent variable and BFI Score Extraversion as the independent variables. The summary of the model was F (1, 201) = 0.051, p > 0.05, R2adj = -0.005. The null hypothesis of a regression analysis says that the two variables are not correlated; that would mean that the correlation forms a straight line, and the variability in the independent variable does not explain any variability in the dependent variable. From the results, one can see that the ANOVA table indicates the general metrics of the model that the model is not significant.
Discussion
The BART test is one of the most revolutionary instruments for measuring risk-taking tendencies. The participant participates by getting rewarded using temporary coins when they pump on a balloon. They have been offered a limited number of balloons, and they want to accumulate as much money as possible, so they must push the balloon to the limit. There is a catch that the balloon could explode, so the player must make a trade-off between continuing to pump the balloon and get more coins or play safe and not risk the balloon bursting; this option, however, comes at the risk of collecting less money.
This paper investigates whether there is a link between risk-taking and extraversion; extraversion is a spectrum of traits from human personality theories. Extroverts would generally be described as outgoing, energetic, talkative while the introverts would be laid back. It is intuitive to think that the introvert and the extrovert have varying degrees of risk-taking tendencies. The question remains whether the introvert can be described as risk-averse since they seem to lack energy and are laid back. The first blow from the result came from the correlation analysis where the variable representing risk-taking tendency does not seem to significantly correlate with the BFI Extraversion Score. Therefore, the results sustain the null hypothesis that had assumed that extraversion did not correlate with risk-taking tendency. Then after performing the regression, the results still confirmed that extraversion does not explain the variability in risk-taking behavior.
One is left to wonder if the experiment is limited or that, indeed, there is no correlation between risk-taking and extraversion. The traits that describe an introvert are that they are not talkative, they are not outgoing and are not bubbly. It has also been demonstrated through literature that introverts thrive in some areas such as computer programming and science. There is a possibility that the BART experiment set-up neutralizes the competitive edge extroverts might have since the game is being carried out in an isolated room. It would seem that the experiment is occurring in an extrovert’s natural habitat: confined space left to their own devices to play on a computer. There is also a possibility that the result is as is and that risk-taking propensity is equally distributed among extroverts and introverts.
Interestingly, it is not that the experiment lacked even a single pair that correlated significantly, but those that did were just not relevant to the research question. For instance, age and risk-taking tendency missed the significance threshold at 0.05 alpha by a little. If one can adjust the alpha to 0.1, then the two variables would be significantly correlated, which makes sense since older people have more experience in life and would be willing to take greater risks.
References
Bran, A., & Vaidis, D. C. (2020). Assessing risk-taking: What to measure and how to measure it.Journal of Risk Research, 23(4), 490–503. Web.
Lejuez, C. W., Read, J. P., Kahler, C. W., Richards, J. B., Ramsey, S. E., Stuart, G. L., Strong, D. R., & Brown, R. A. (2002). Evaluation of a behavioral measure of risk taking: The balloon analogue risk task (Bart).Journal of Experimental Psychology: Applied, 8(2), 75–84. Web.
Slovic, P. (1964). Assessment of risk-taking behavior.Psychological Bulletin, 61(3), 220–233. Web.
Appendix 1
Results
Descriptive Statistics
Descriptive Statistics.
Note. Not all values are available for Nominal Text variables ᵃ More than one mode exists, only the first is reported.
Distribution Plots
Age Gender

AdjAvgPumps BFI Score Extraversion

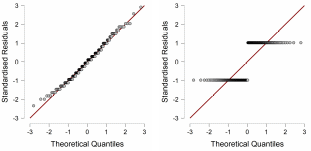
Q-Q Plots
Age AdjAvgPumps
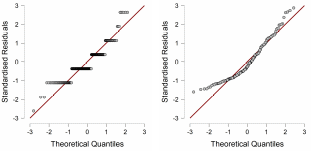
BFI Score Extraversion Extraversion Group
Appendix 2
Results
Independent Samples T-Test
95% CI for Cohen’s d.
Note. Student’s t-test.
Assumption Checks
Test of Normality (Shapiro-Wilk).
Note. Significant results suggest a deviation from normality.
Descriptives
Group Descriptives.
Correlation
Pearson’s Correlations
Linear Regression
Model Summary – AdjAvgPumps.
ANOVA
Note. The intercept model is omitted, as no meaningful information can be shown.