Introduction
Research has been used in various fields, including marketing. Managers have realised that making decisions backed by relevant data is critical for the survival of their organisations. Since the inception of computers and the internet, the field of business and marketing has experienced a paradigm shift towards using the internet as a platform to carry out business and related transactions (Malhotra, Hall, Shaw & Oppenheim, 2008).
However, despite its various advantages such as reducing the cost of doing business, increasing reliability and convenience, among others. There are some disadvantages such as security and privacy issues, compatibility, losing human interaction in doing business, among others which have proved to be a hindrance to some potential customers from adopting this new technology (Mathews, 2010). As a result of this and other issues concerning online or e-commerce, there is a need for firms to carry out research so that they can be able to make rational decisions that will, in the long run, help them fully utilise online business as a competitive advantage (Eisingerich & Kretschmer, 2008).
In this paper, SPSS software has been used to analyse a questionnaire administered to 5000 people who visited the Auto Online website. It is worth noting that out of the targeted respondents, some bought their cars online while others bought their new car through leadership. To accomplish this task, the essay will determine the level of measurement of all the questions in the questionnaires, carryout suitable descriptive statistics of all the 19 questions. Lastly, cross-tabulation will be carried out to establish if there is a relationship between gender and respondents purchasing a new car from the company’s website and the relationship between gender and the frequency of visiting the website. The culmination of the task is to bring to light the marketing implications of the findings.
Level of measurement
It is worth noting that in any research, the data collected falls in one of the four levels or scales of measurement; nominal, order, interval or ratio scale. Variables falling under nominal scale have value but with no mathematical interpretation and have a difference in quality but not quantity. The major characteristic of this level of measurement is naming or labelling attributes. Data can only be put into groups and counted by frequency (Burns & Bush, 2010).
Data are falling under ordinal exhibit certain order or ranking from the lowest to the largest or vice versa. The order is indicated, but the different magnitude of a given attribute is not indicated. Those data falling under interval scale data have a fixed measurement unit but lack the true zero characteristics (Michell, 1997). One can interpret both the order of the scale score and the distance between them. An example is a temperature. Lastly, data categorised as ratio scale is of the highest level of measurement. It possesses the characteristics of an interval scale as well as having a fixed origin (true zero point). An example of data falling under this level of measurement encompasses height, weight, as well as time (Michell, 1997).
Table 1 Level of measurements.
Descriptive analysis
Question 1
When asked whether the respondents visited the company’s website in the past three months, it emerged that all of the 1400 respondents answered yes. This means that the company’s desire to exclusively recruit those respondents who had visited the firm’s website in the last three month was accomplished (Table 2).
Question 2
From table 3 above, it is parents that when asked about how often the respondents make purchases through the internet, 19.9% said never, 23.6% said almost never, 23.0% said occasionally, 21.3% said often, and only 12.1% said very often. This means that close to 45.0% of the respondents visited the company’s website, but they rarely make purchases online. Interestingly those who were more likely to makes purchases through the internet were comparable with the former group. No cases were missing.
Question 3
From table 4, it is evident that more respondents did not agree that they like using the internet (43.5%). Only 33.0% agreed to some extent that they like using the internet. When asked about using the internet to research purchases they make, it emerged that majority of the respondents agreed with the statement since 40.3% said they use the internet to research purchases they make. Additionally, when it comes to the safety of purchasing through the internet, it emerged that almost half of the respondents were sceptical of the internet being a safe avenue to make purchases 43.7% somehow disagreed that it was safe to purchase from the internet.
Concerning the issue of the internet is a good tool to use when researching an automobile to purchase, it emerged that majority of the respondents were in some disagreement with the statement (43.8%). It also emerged that about 37.7% and 32.3% were somehow agreed and disagreed with the statement that the internet should not be used to purchase vehicles. Over 60.0% of the respondents were not of the view that online dealerships are just another way of getting one into the traditional dealership. This means that most of them understood that buying through the internet is quite different from the traditional way of buying vehicles through traditional dealerships.
When asked whether they liked the process of buying a new car, it emerged that close to 72.1% of the respondents disagreed. Only 11.9% said they liked the process. This means that the firm needs to change some attributes of its websites to appeal to more customers to make purchases online. It is worth noting that 54.1% of the respondents agreed that they do not like hassling with car salespeople. This thus gives the firm a perfect opportunity to capture them and increase revenue and market share.
Question 4
Table 5 shows the average number of times the respondents visited the internet before buying an automobile. The average time the respondent visited the website is 6.61 times while the mode was 6. This means that the majority of the respondents visited the site six times. The maximum number the respondents who visited the website is 16 times, while the lowest number of visits stands at 1. The standard deviation was 3.171, meaning that the majority of the respondents visited the sites 6.61+or-3.171.
Question 5
Indeed, a firm can use various ways to reach the various market segments to inform them of the new platforms. Among other things, the respondents were asked how they found out about Auto Online. It emerged that 5.8% learnt of its existence through friends, 16.9% through internet banner, 66.4% through search engines, 3.7% through theatre, 2.6% through some other ways, 3.4% through billboard, 43.4% through web surfing, 32.3% through television and only 5.3% through the newspaper. Thus it is prudent to say that the most popular media that can be used by the firm to reach more potential customers is through the internet, television and friends.
Question 6
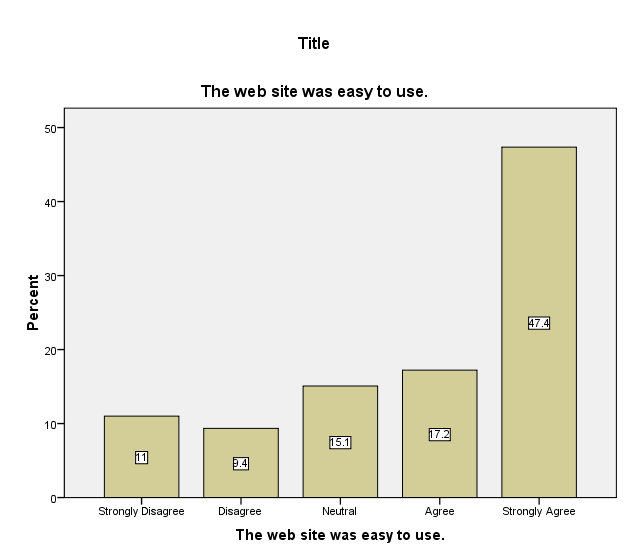
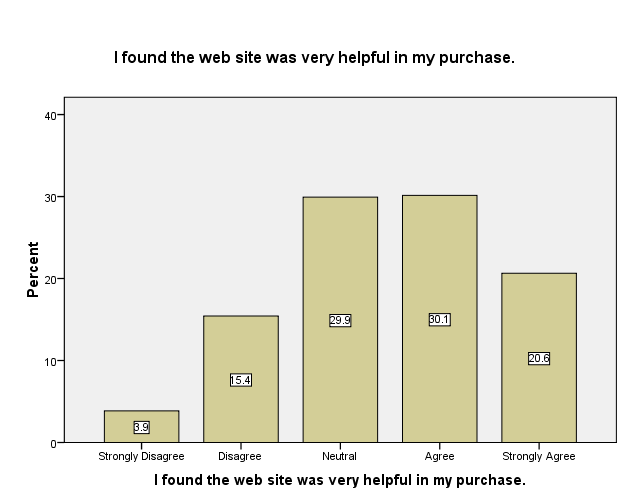
It is evident from figure 1 shows that majority of the respondents were in agreement that the website was easy to use. From figure 2, it is evident that about 50.7% of the respondent agreed that they found the company’s website to be very helpful in making their purchases. However, about 30.0% were neutral, while only 19.3% disagreed.
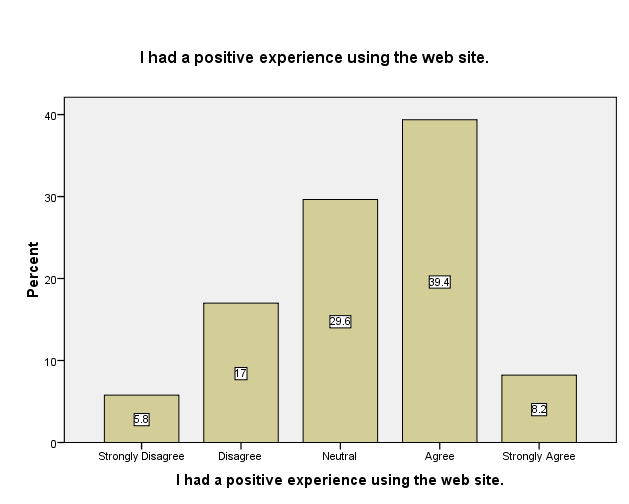
It was interesting when the respondents were asked about having a positive experience after using the website. 5.8% strongly disagreed, 17.0% disagreed, 29.6% were neutral, 39.4% agreed, and 8.2% strongly agreed. This means that there are a group of people who still do not know whether the experience was positive. The firm thus needs to incorporate a number of attributes that will make customers have a positive experience with the company’s website.
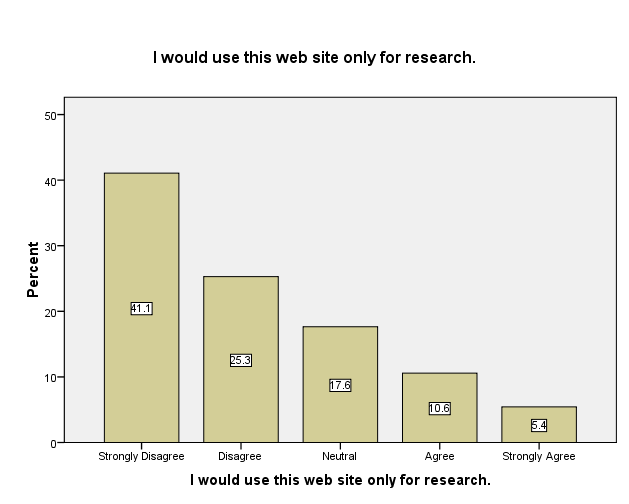
One can gather from figure 4 that the company website is not only useful for research only. It is evident that 66.4% disagreed that they would use the website only for research. This means that asides from using it for research purposes, they are willing to use it for other purposes such as making orders, among others. Only 16.0% said they would use the website only for research.
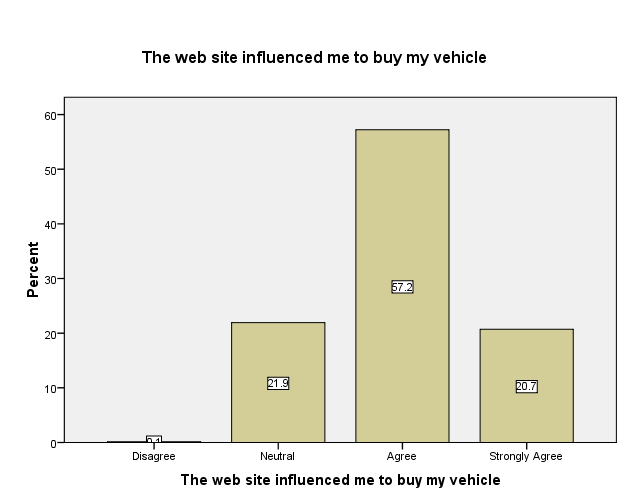
It is prudent to say that when asked whether the web site influenced the respondents to buy the vehicle, it emerged that approximately 77.9% agreed while 21.9% were neutral. Only 0.1% disagreed. This means that a website is a powerful tool to influence customers’ decision to buy products or services online.
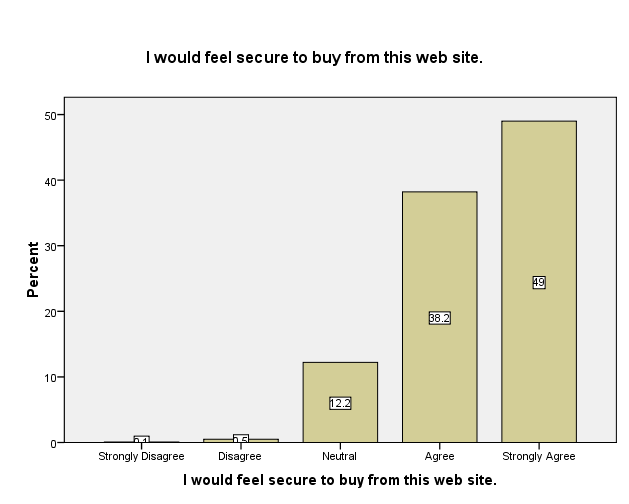
When asked whether the respondents felt secure when buying vehicles from the website, it emerged that 87.2% were in agreement, 12.3% were neutral, while 0.6% disagreed. This means that more of the respondents felt that it was secure to make purchases from the company’s website. However, there is a need from the firm to embark on activities or a campaign that will help dispel the fear among those who disagreed with making purchases online in fear of security issues.
Question 7
When asked about whether the respondents bought their new vehicle on the Auto Online website, it emerged that only 20.5% said yes while 79.5% said no. this means that the majority of the respondents did not buy their new car through the company’s website despite visiting the website.
From table 7, it was of interest to establish whether the experience of buying was better than the traditional dealership. It emerged that only 19.4% said it was better while 1.1% said no. However, it is worth noting that there were 1113 missing cases representing 79.5%.
For those who respond that the experience was better than the traditional dealership, 8.45% said it was a great deal better, 5.1% said it was much better, 4.1% said somewhat better, while 1.8% said just a bit better, totalling 19.4%. There were 1128 missing systems representing 80.6%.
Question 8
From table 9, it is evident that a total of 33.5% disagreed with the statement that people feel that the internet is not a safe place for personal information, while a total of 48.2% agreed.
Table 10 represents respondents’ views on whether they agree or not about testing the performance of the vehicle before buying it. 59.1% strongly agreed, while only 0.6% disagreed.
From table 11, it is shown that majority of the respondents, 35.8% strongly disagreed that one can negotiate a better price by talking with a sales representative, while 28.1% were in strong agreement with the statement.
When asked about whether people usually have trade-ins that are too complicated to deal with online, 33.3% strongly agreed while 27.0% strongly disagreed (Table 12).
From table 13, it is evident that the majority of the respondents were strongly in agreement with the statement that people like to have a hand in the situation when buying different options for their vehicle.
When the respondents were asked whether they want to see the vehicle before they buy to check for imperfections, only 1.6% strongly agreed, while 57.3% strongly disagreed (Table 14).
Question 9
Concerning the duration in terms of weeks that the respondents were actively searching for their vehicles, it can be gathered from the analysed data that the mean week was 3.61, the median was 3.0, and the mode stood at 1. The majority of the respondents were searching for their vehicle for only a week. This being the minimum number of weeks while 12 being the maximum number of weeks one was actively searching for his or her vehicle. It is worth noting that there were no missing cases.
Question 10, 11 and 12
Questions 10, 11 and 12 are summarised in table 16. When asked about the price of the car the respondents traded in, it emerged that the minimum price was $1,000 while the maximum price was $31,000. The standard deviation was $5,331.39, meaning that the majority of the respondents traded in a vehicle whose price ranged between $15,709.48 and $5,046.69. The mean was $10,378.09. The actual priced they paid for averagely was $13,181.43, the maximum price paid was $33,000, and the minimum was $5,000. The standard deviation was $5,017.90. The approximate sticker price for the respondents’ new vehicle mean was $15,496.43, the maximum and minimum sticker prices were $35,000 and $10,000 (table 16).
Question 13
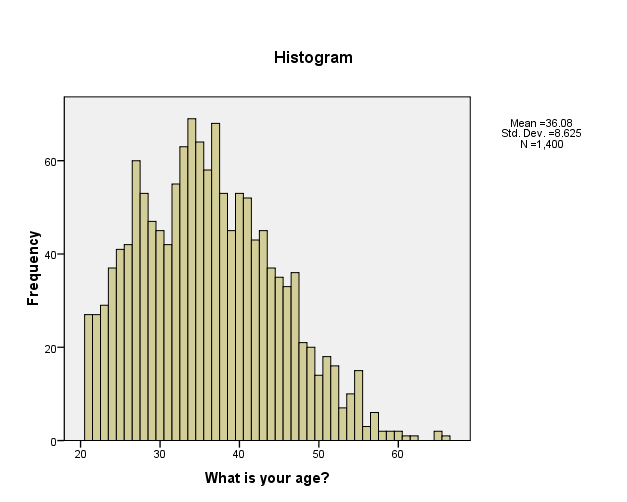
When asked about their age, it emerged that the mean age of the respondents was 36.08 years and the standard deviation was 8.625 years.
Question 14
Concerning marital status, 39.9% were single, 41.5% married, 0.6% widowed, 14.9% divorced and 3.2% separated (Table 17).
Question 15
When asked about the number of children under the age of 18 years the respondents were living with, it was established that some respondents had no child while the maximum number of children one was living with were 5. The mean was 1.42, meaning that the respondents were likely to live with at least one child. The standard deviation stood at 1.018. This can also be seen in table 19 below;
Question 16
From table 20, it is evident that 10.7% had less than high school level of education, 16.4% had acquired high school education, 23.4% had some collage education, 21.1% possessed undergraduate degree, 16.8% were graduate degree holders, while 11.6% had acquired other level of education.
Question 17
Concerning the race of the respondents, it is established that 68.5% were Caucasian, 15.5% were Blacks, 9.1% were Asian, American Indian were represented by 0.1%, Hispanic 6.2% and others 0.6% (Table 21)
Question 18
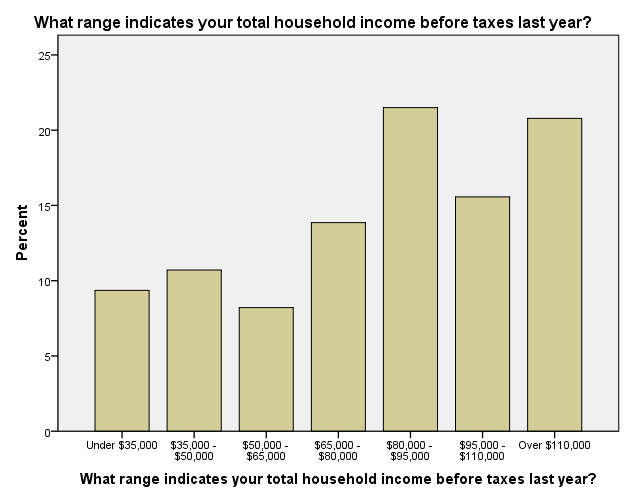
From figure 8, the families whose income before taxes were under $35,000 were represented by 9.4%, between $35,000-$50,000 were represented by 10.7%, between $50,000-$65,000 were 8.2%, 65,000-80,000 were 13.9%, $80,000-$95,000 were 21.5%, $95,000-$110,000 were 15.6% and those families earning over $110,000 were represented by 20.8%.
Question 19
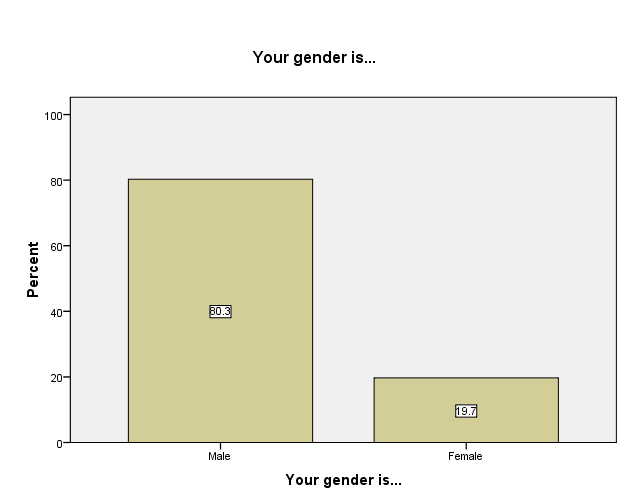
It is worth noting that 80.3% of the respondents were males, while 19.7% were females. The gender was not well balanced.
Cross tabulation
To establish whether there was a relationship between gender and buying a new car online, a cross-tabulation will be carried out. Ideally, cross-tabulation entails merging the frequency distributions of two or more variables in a table. This method was chosen because it will help in examining the direction of the relationship as well as the level of significance; how one variable relates to another variable (Coakes, Steed & Price, 2008). Additionally, the data type, which is categorical variables, meets the requirement of using this method (Burns & Bush, 2010).
From the table above, it is evident that there are no missing cases. This means that all the 1400 respondent answered the two questions about their gender and buying a car online.
Table 18 shows the cross-tabulation results. It is evident that a total of 287 respondent representing 20.5%, bought their new car online, while 1113 respondents did not buy their new car online, representing 79.5%. It is also apparent that 227 males, which represent 20.2%, bought their new car online while 897, which represent 79.8%. On the other hand, only 21.7% (60) of female admitted that they bought their new car online, while 78.3% (216) did not buy their new car online. It is thus evident from the results that males were more likely to buy a new car online compared to female (Coakes, Steed & Price, 2008). This can be clearly seen in the bar graph below
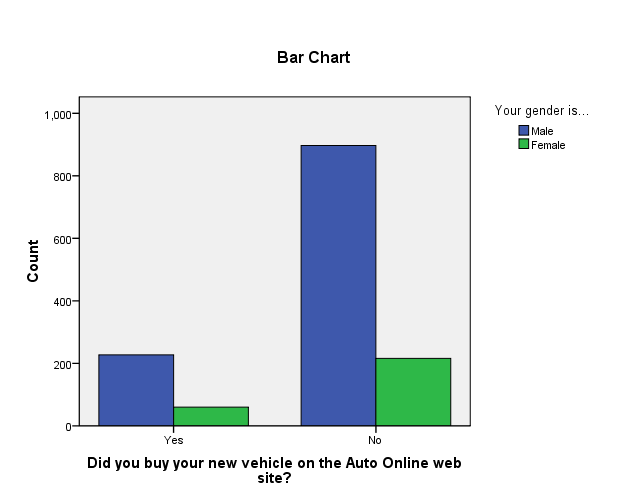
It was also of interest to establish if the relationship between gender and buying a new car online was significant. However, after carrying out a cross-tabulation with chi-square checked, it emerged that the relationship is not statistically significant 0.569 is greater than the p-value of 0.05. This means that gender does not dictate whether or not one will buy a new car from the internet. This means that there must be another factor, which dictates buying a new car online.
Marketing implications
From the analysis, it is evident that some respondents still show scepticism about internet security and safety. This calls the firm to incorporate better security measures on the website. Additionally, it has been shown that most males engage in buying new vehicles online. Although there was no statistical significance between gender and buying vehicles online, it emerged that there was statistical significance between gender and making purchases online; the firm needs to come up with better strategies that will make more females buy new cars through the company’s website, this might include giving those who buy new cars online some incentives like prolonged after-sale services, gifts among others.
Conclusion
Research in business guides decision making. This paper has done the following; categorised data collected through an online survey into one of the four scales of measurement (nominal, ordinal, interval and ratio), carrying out descriptive statistics on all questions and finally establishing if there is a relationship between gender and buying a vehicle from the company’s website.
References
Burns, A & Bush, R 2010, Marketing Research. Pearson Education, Upper Saddle River.
Coakes, J, Steed, L & Price, J 2008, SPSS: Analysis without Anguish: Version 15 for Windows, John Wiley & Sons Australia, Milton, QLD.
Eisingerich, A & Kretschmer, 2008, “In E-Commerce, More is More”, Harvard Business Review 86, pp. 20–21.
Malhotra, N, Hall, J, Shaw, M & Oppenheim, P 2008, Essentials of marketing research: An applied orientation. Prentice Hall, Sydney.
Mathews, S. 2010, Internetalisation: The internet’s influence on international market growth in the firm’s outward internationalization process. Web.
Michell, J 1997 “Quantitative science and the definition of measurement in psychology” British Journal of Psychology, 88, pp. 355–383.
Appendix
Table 4. Frequency table for question 3.