Weight lifting is a physical activity that allows individuals to perform exercises that are central to maintaining a healthy body. Since people in modern society live stationary lifestyles, which do not allow them to perform physical activities, they predispose themselves to overweight and obesity. To prevent overweight and obesity, dieticians, nutritionists, and physiotherapists recommend that individuals should perform regular exercises such as aerobics and weight lifting. Weight lifting is an intensive physical activity that enables individuals to cut much weight within the shortest time possible, and build strong muscles that actively burn fats. In this view, physiotherapists need to understand the maximum weights that individuals can lift based on their ages. The relationship between age and weight lifted is essential in determining the weights people need to lift so that they can perform optimal exercises and avoid injuries due to overexertion. Moreover, when individuals perform tasks that involve lift the heavy objects, they may experience injuries due to overexertion. Gross et al. argue that age is a significant anthropometric measure that determines the maximum lift capacity of an individual (239). Hence, physiotherapists use age in determining the weight that an individual need to lift. Therefore, this report seeks to compare age and maximum weight that an individual can life with a view of deriving the relationship between age and weight lift capacity.
Aims
- To calculate the descriptive statistics of participants’ age and weight lift capacity.
- To compare age and weight lift capacity among the participants.
- To establish if age and weight lift capacity has any correlation.
- To compare analyses of the data with literature values and provide an explanation for their variation or similarity.
Data Collection
The study collected data from 30 participants (N = 30) who took part in weight lifting. To determine the maximum weight an individual can lift, participants were asked to lift different weights, which were progressively increased. The ages of the participants ranged from 17 to 60 years. The age range was 43 years, which is broad enough to study the relationship between age and weight lift capacity. When each of the participants attained maximum lift capacity, the weight was recorded in table 1 as shown below.
Table 1: The participants’ age and weight lifted.
Data Analysis and Presentation
Descriptive Statistics
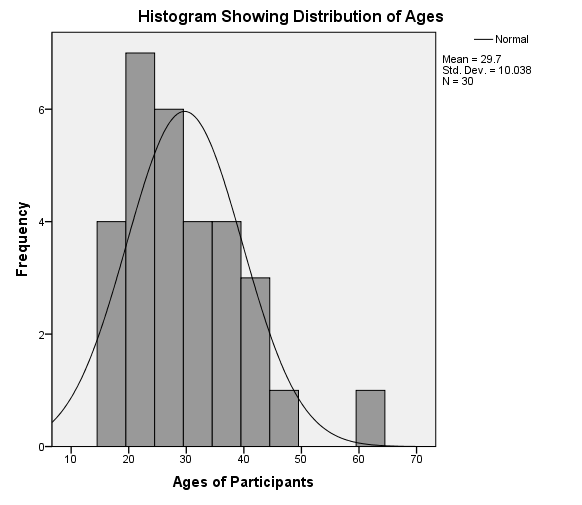
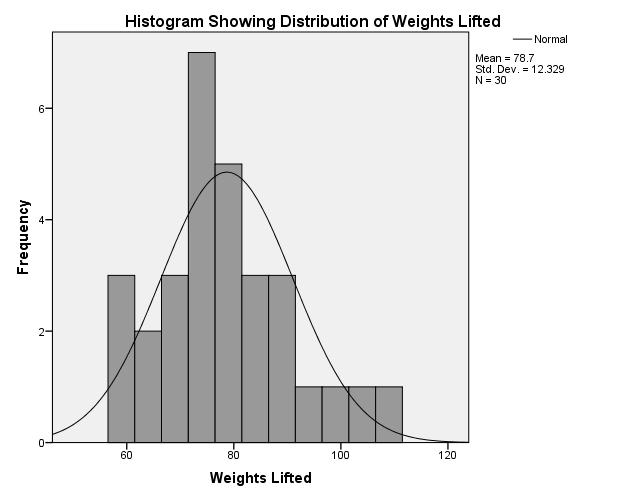
The descriptive statistics depict measures of central tendency such as mean, mode, and the medium of both the ages and weights lifted by the participants. The mean, mode, and median for ages are 29.7, 21, and 27.50 respectively. These measures of central tendency show that the distribution of ages has some skewness because the mode seems to be an outlier in relation to the median and mean. Hence, the majority of the participants were aged below the mean age. However, the distribution of the ages follows a normal distribution. Comparatively, the measures of central tendency for the weight lifted are 78.7, 76, and 75 for mean, median, and mode respectively. These measures show that the weights lifted by individuals are close to the mean. This implies that the weights lifted follow normal distribution because the mean, the mode, and the median are almost the same.
Moreover, the descriptive statistics also portray measures of dispersion such as standard deviation, variance, and range. The standard deviation and variance of the ages are 10.038 and 100.769 respectively. This means that about half of the individuals with the ages of between 19 and 39 years fall within the first standard deviation (M ± SD = 29.07±10.038). Hence, the majority of the participants had the ages of between 19 and 39 because they fall within the range of the first standard deviation. The range of the ages is 43 as the minimum age is 17 years while the maximum age is 60 years. Comparatively, the standard deviation and the variance of the weights lifted is 12.329 and 152.01 respectively. Given that the standard deviation is 12.329, it implies that the weights lifted by the majority of the individuals range between 90 and 66 kilograms (M ± SD = 78.7±12.329). Additionally, the range of weights lifted is 48 because the minimum weight lifted is 59 kg while the maximum weight lifted is 107 kg.
Table 2: Descriptive statistics.
The descriptive statistics of the ages and weights lifted are almost similar to descriptive statistics available in the literature. Gross et al. found that 35 men (N = 35) with a mean age of 29.7 years lift an average weight of 100.39 kg (239). In comparison, in this study, the participants have a mean age of 29.7 years, but the mean of the weights lifted is 78.7. Hence, although the participants in the study and literature have almost the same mean ages, the mean weight lifted is significantly different. The difference in weight capacity is that the age range of the study participants is 17 to 60 years, while the age range in the literature is 22 to 40 years. Therefore, the difference in age ranges is one factor that explains why the literature mean value of weight lifted is different from this study’s mean value.
Distribution of Data
The analysis of data shows that both the ages and weights lifted are normally distributed. Skewness and Kurtosis depict that the distribution of both the ages and weights lifted follows a normal distribution because they are within the ranges of a normal curve. According to Lomax and Hahs-Vaughn, skewness and kurtosis values of a normal curve take absolute values that are less than two (45). The skewness of the ages is 1.062 (SE±0. 427), while the kurtosis is 1.264 (SE±0. 833). In comparison, the skewness of weights lifted is 0.535 (SE±0. 427), while the kurtosis is -0.38 (SE±0. 833). In this view, since the skewness and kurtosis values are less than two, the distribution of ages and weights lifted follows a normal distribution.
Table 3: Descriptive statistics.
Density Curves
The density curves below (Fig. 1 and 2) depict the distribution of participants’ ages and weights lifted respectively.


The Relationships between Ages and Weights Lifted
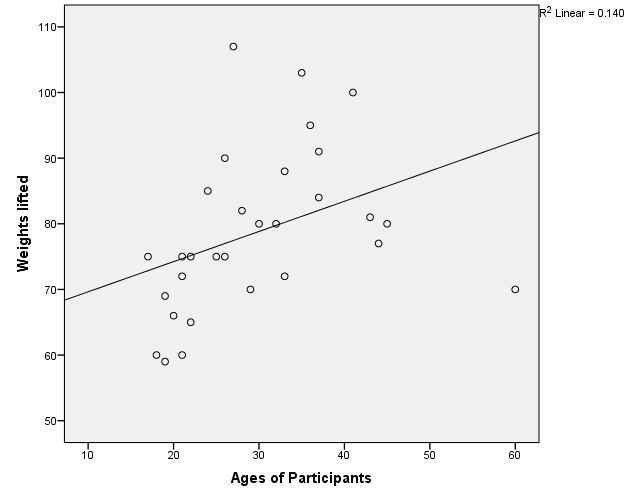
Correlation analysis shows that age and weights lifted have some correlation. The correlation of the age and weight lifted is positive. However, this correlation is a weak one (r = 0.374). This means that weights lifted among the participants increased with their ages. When compared to the literature value, this correlation value is weak. Saunders, Beissner, and McManis state that the correlation coefficient of weights lifted and age is greater than 0.85 (1727). The difference in correlation could be due to the body mass index of participants because it determines the capacity of an individual to lift weights.
Table 4: The participants’ ages and the weights lifted.
Significance Testing
To establish if the correlation of age and weight lifted is significant, the chi-square test and cross-tabulation method was used. From the chi-square table, the value is 0.053. The chi-square test value shows that the correlation is insignificant because it is greater than the significance level (p>0.05). Since the chi-square value is close to the significant value, cross tabulation is necessary to magnify the apparent relationships. From the correlation table, it is evident that the dominant participants in the lightweight category are young adults (n = 7), while the dominant participants in the heavyweight category are adults (n = 4). However, in the medium-weight category, the number of participants is almost equal. Thus, the correlation table portrays that age and weights lifted have a significant relationship.
Scatter Plot
Cg=ChiC

Chi-Square Test
Table 5.
Cross-Tabulation
Table 6.
Conclusion
The descriptive statistics depict that ages and weights lifted by participants follow a normal distribution as indicated by the measures of central tendency and dispersion. Moreover, skewness and kurtosis portray that the ages and weights lifted are normally distributed. The analysis of the data shows that age and weights lifted have some relationships although they are not statistically significant. Comparative studies affirm that age determines the capacity of weights that individuals can lift. In this case, the insignificance of relationships could be due to the ages of participants and the other demographic factors like body mass index.
References
Gross, Michael, Ennea Dailey, Melissa Dalton, Angela Lee, Tracy Mackiernan, Wendy Vernon, and Ashley Walden. “Relationships between Lifting Capacity and Anthropometric Measures”. Journal of Orthopedic & Sports Physical Therapy 30.5 (2005): 258-262. Print.
Lomax, Richard, and Debbie Hahs-Vaughn. An introduction to Statistical Concepts. New York: Routledge, 2013. Print.
Saunders, Robin, Katherine Beissner, and Beth McManis. “Estimates of Weight that Subjects Can Lift Frequently in Functional Capacity Evaluations”. Physical Therapy 77.12 (1997): 1717-1728. Print.