Company Selection
HBG UK Ltd is one of the leading construction services organisations, which has the turnover among 300 million to 1500 million that has been required in this task. They provide an integrated service covering a large quantity of developments according to their range, complexity or industry sector. Their high-quality scheme to every area of operations like- investment, construction, maintenance, and development, design emphasises clients to become attached within the organisation.
Collection Of Information
HBG is a part of Royal BAM Group, which is a £5.9 billion construction, and Property Company that has been included on the Dutch Stock Exchange. HBG group of industries has an annual turnover of merely £850 million while the individual construction company has a turnover of 790.4 million in 2006 & 731.8 million in 2005. The group operates in both public and private sectors that actually provides five core business options – Design, Property Development, Facilities Management, PFI Projects & finally construction.
The group’s property development arm provides high-quality retail, office and commercial space for both the sectors. Most of the clients have been with HBG from the starting & repeating trade for their huge amount of turnover. HBG UK Ltd has been continuing its increasing profit with excellent view for 2006 and eventually the company had introduced 2007 with another record of £1.6 billion at December 31, 2006 while it was £1.4billion in 2005. PBT or Profit before tax in 2006 was £42.0million & in 2005 it was £24.3million.Deducting tax, the profit available to shareholders was £31.6million while in fiscal year 2005 it was £19.2million.
Similarly, HBG UK operates to perform strongly to provide an upward & greatly improved profit before margin of tax of 4.8%, while in 2005 it was 3.1%, that produced a 72.8% rise in the overall profit level before taxation in the same year. At the same time an increasing beneficial output from construction businesses, the group’s property development business has also taken facility of the current rising demand for high quality developments over the year in order to finish a number of initial property disposals that includes the redeveloped Wellgate Centre located in Dundee that is an investment property.
In the competitive construction market, the group’s project portfolio has been characterized by a great extent of framework, partnership & also a negotiated business. By this time the sector of education, healthcare, commerce, healthcare etc are shown as the company’s strongest & biggest markets accompanied by high profile, respectable projects for historic attentions.
HBG UK provides a high regard towards its safety standards. Maintaining its statutory obligations, it has identified the possible acceleration of high standards of health and safety, advancement from a sound health and safe policy is able of making an enormous contribution to the business efficiency. Similarly the ‘All accident reports’ has been decreased by 20% in 2006 rather than 2005.
The group’s properties had an exclusively busy 2006 with a number of new land and property achievements & the fruitful lettings and sales. Additionally, 102,100 sq m of development of new property was undertaken by HBG in 2006, against to the disclosure of 51,482 sq m of developments of retail & office.
A short financial overview of the HBG group & HBG Construction is given below-

Company Description & Analysis
The biggest division of the group is HBG construction ltd that has established vast facilities all over the UK covering schools, hospitals, shops as well as parks of business. Every project is distinguished according to complexity & methods of construction. Similarly each project faces separate major challenges. The company is exclusively conscious for the customers; its chain of supply and operations is intrinsic to the business objectives. Some of the important criteria of HBG are given below: –
- Employment: As the company’s major goal is to satisfy customers by the dedication of the project delivery and services, it needs the employees who are unique in terms of leadership & professionalism. For this reason the company is trying to identifying the new & changing human skills that are essential to meet the further demands and developing those skills as the most important issue.
- Growth: The Company’s constant growth rate over recent years has been showing the success of high profitability as its targets include increasing return to the shareholders. For this, it has a clear strategy, risk management, project selectivity, and innovative ideas of achieving this goal.
- Customer delivery services: The Company’s ability of delivering services over complete construction is a subject of demand by numerous customers and also market sectors. It has flexibility in designing, constructing, financing, maintaining or developing that is combined on an interrelated basis that provides control and competitive era also. As an employer & a part of community, now the company is offering a regional service & it is noted by the regional office’s national network that enables it to perform locally.
- Social responsibility aspect: The Company was listed for the 3rd consecutive award, 2007; also in 2005 it won for its quality the ‘Corporate Social Responsibility Achievement Awards’. This shows the company’s total commitment of meeting it’s responsibilities of delivering sustainable business operations regarding environmental quality, social concern & economic success. It also successfully implemented HBG LIFE that means Leading towards an Incident Free Environment program that was started at the last of 2005 & delivered during 2006-2007. The objective of the program was to maintain corporate responsibility of changing climate, waste recycling, energy consumption etc. That program also consolidates social health, safety, welfare as well as environmental management of which 90% of the corporate projects are supported by Environmental Department to assist Environmental Management Plans. This program also involves separation of waste & waste deduction by recycling process. Also it is an associate of the scheme of CCS.
As the company concentrates of providing extraordinary community relations by all of its project sites, it has achieved the best ‘Considerate Construction Scheme’ & gained an average score of 34.1 out of 40 in the year 2006 while the industry average was 30.8 in the same year.
- Competitive & Legislative risk: The Company experienced the typical commercial risks that are also faced by its other competitors in the construction market. Thus it is try to omit these risks by concentrating to produce high quality services & a mixed portfolio projects among the various market sectors. It is also using a highly selective approach to operate of bidding selection for construction that involves the maximum scope for framework contracts & other projects that are needed to be negotiated.
The company is specially required for legislative risks, such as Construction Industry Scheme, Related Building Standards for Construction etc which have been achieved by the establishment of ‘Best Practice’ methodology & employee training program. The use of specialists within the whole HBG group having relevant knowledge as well as experience for the pro-activation for managing those risks & ensuring compliance at the top level has also increased the company’s risk management capability.
- Financial risk management: It is an initial part of any company’s management process. For this effective policies are formed to recognize, manage & reduce the existing & future risks at different management levels. HBG manages its credit risk by broadening its liquid assets investment across a number of qualified financial institutions & also operates credit management technique as a normal business practice. Price risk is seemed at the corporate level & it is monitored on the basis of ongoing. Cash flow & liquidity risk is managed by the preparation of budget & medium term plans & forecasting quarterly although it has been monitored.
Director’s Statement Analysis
The overall financial, sales, profitability, investment, operational & performance module of the company shows an optimistic position of the company. Thus the directors of HBG Corporation have stated & recommended on various aspects & comparisons of the relevant financial years. Such as-
The directors’ report shows that the profit before tax or PBT was £19.2 million in fiscal year 2006 while it was £14.2 million in 2005. After subtracting tax, the amount was £13.3 million while the year 2005 showed it as £9.9 million. During 2005 declared dividend was £0 but in 2006 it rises & showed an exclusive amount of £18.5 million.
The principal activities along with the subsidiary undertakings of HBG are designed format contracting & traditional buildings & skyscrapers in UK. The overall financial position of the company shows that there is an 8% increase in turnover in 2006 compared to the year 2005. PBT has been improved of 2.4%in 2006 while 2005 showed the percentage of 1.9% & 35.2% rise in overall profit before tax in 2006.
Shareholder’s funds have been decreased in 2006 because of payment of dividend. Year ending cash position rose to 109.1 million while the previous years record for the aspect was only 50.4 million. Effective management of net current assets has also increased in 2006 than 2005.
The company maintains its safety standards & complies with its statutory obligations. Similarly, it has identified the high standards of health & safety policy that can make a magnificent contribution to its operational efficiency. The company’s Construction Skills Certification Schemes Cards, which has been implemented among the stuff, was maintained with 91% compliance for the employees who work directly & 90.5% with the subcontractors.
HBG’s project portfolio is characterized by a large volume of framework, negotiation & partnership business while in 2006, education, healthcare & commercial sectors are seemed to be as the most powerful segments for the company.
During that year the company had worked on 20 universities, 10 colleges & 20 schools in Britain. The company has also been selected as one of 3 supply chain partners for Welsh Health Framework, for this, in South Welsh HBG won many hospital building contracts. It works for numerous nationwide works of retail clients of UK, such as – ASDA, Marks & Spencer, Sainsbury’s & Morrisons & Tesco etc. These types of works of HBG have placed it in the leading position within the sector of retail market.
The company is carrying out a huge project scale in the mixed development sectors as well as the commercial office, which include AMA, London & Regional (55 Baker Street), in Hall London & ING Real estate developments. Natural History Museum in London & in Oxford, the Ashmolean Museum is the two major projects of HBG that have been highlighted in 2006.
HBG works with its own civil engineering sister company very closely named BAM PPP UK & Edmund Nuttall on both future & existing projects while the internal expertise & experience provide additional values for the clients. The company possesses a great social responsibility to the community & customers. It minimizes the environmental impact of their operations, maximizes sustainability, promotes reasonable community relations, provides similar employment opportunities & creates the right work life balance for all staffs. Its corporate social Responsibility policy ensures that it maintains social aspects in all of its projects.
The board expects that the company will continue its existing market sectors development over the next fiscal years. Thus the directors will continue the existent development policies & procedures for safety, community & environmental issues that will confirm the recent growth & sustainability that may help the company to achieve reliable profits.
The qualifications of company’s ultimate parent of undertaking liability & insurance indemnity for the officers & directors have been established all over the year & remains by the approval of director’s report.
In case of payment policy, though the company does not follow any specific payment code, the payments those are made in accompanying with those conditions are agreed & maintained between the company & its suppliers, ensured that all the terms & conditions are complied with. In 2005, the company had an average of 20 days of purchases outstanding in terms of trade creditors due & subcontractor’s accruals while the same option increases in 24 days in 2006.
In terms of exposition of potential credit risk like trade debtors & liquid assets, the company manages it by spreading the investment in liquid assets over a number of high quality financial institutions. It also uses the additional specified methods to manage its price & liquidity risk. Competitive risk is simply minimized by delivering a high quality services as well as a mixed portfolio of numerous projects.
As long as a person is being director of the company is responsible of approving the auditors report as there is no audit information needed by the auditors or while preparing that report if the auditor is being aware. After completing the enquiries by the director & the auditor, the individual director is responsible to take all the steps of which he is obligated in order to make himself cautious of the relevant audit information & establishing that the auditor is also alert of that information.
Required director’s responsibilities
The directors are liable of preparing the annual report that is accompanied with appropriate laws & regulations. By maintaining accurate company laws, each year the directors prepare year ending financial statements. And this is simply done by maintaining with UK’s Generally Accepted Accounting Techniques or GAAP. The law that gives a true & fair view of all the affairs of the company & its obtained profit & loss for the given period follows the accounts. In preparing such accounts, the directors are responsible to-
- Select the appropriate accounting policies & later apply them.
- Make value judgment & prove that are reliable & reasonable.
- Provide statement of applicable UK accounting standards that have been followed & show whether it’s a subject of any material departure by explaining the accounts.
- Use the going concern concept of accounting if the company decides that it will continue its operation in future.
In short, the directors are completely responsible in keeping proper accounting records that will show the financial accuracy & original position of the company that will follow the company’s act 1985. Safeguarding of assets of the corporation & taking appropriate steps for preventing & detecting the fraudulent activities & irregularities are the additional responsibilities of company directors.
Auditor’s Report Analysis
The Company had prepared the accounts for 31st December 2006 that is composed of Profit & Loss Account, Statement of total Gains & Losses (recognized) & the Balance Sheet accompanied by the related notes. The auditors have made the report to members of the company according to the Company Act 1985 with the section of 235. The purpose of the audit task was to provide the statement to those members of the company whose matters are required to the report but not for other issue. The report is made through the full permission of law & for that there is not assuming or expecting responsibilities from other than its members.
Responsibilities of the Directors and Auditors
In the director’s responsibilities part, we have already mentioned that directors prepare the final accounts by following the applicable United Kingdom law & Accounting Standards (GAAP). Similarly, auditors are required to perform their task by following the relevant requirements & Auditing Standards (UK & Ireland) through which a true & fair view of the company will be presented.
Thus according to the auditors opinion, HBG has not maintained the proper accounting records, so if they would have not taken all information that are needed for auditing, or either those information are specified by law according to the directors reference, there would not be a full disclosure of transaction. For this, they have revised director’s report to become aware of any false or misstatements within it.
Basis of Auditors Opinion
The audit task consists of test basis examination that is evident & relative to the amounts along with the full disclosure. Also, it includes the assessment of significant estimation & value judgment by the directors while preparing the accounts or whether the policies of accounting are fitted to the company’s position & circumstances those are applied & fruitfully revealed. The auditors assured that all the necessary information & explanation are taken in order to give the faith that the accounts are free from misstatements causing by fraudulent, error or other irregularity.
In short, the opinions are-
- The accounts show a true view according to thee UK’s GAAP, sate of company’s finance at December 31’ 2006 & ending profit of the year.
- Following Company Act-1985, formulates the accounts.
- Showing consistency of the Director’s report.
Analysis of Company Performance & Calculation of Ratios
The following financial ratios those are used to estimate a business’s ability to generate earnings, financial position, liquidity, debt management & asset management relative to the benchmark position in the market.
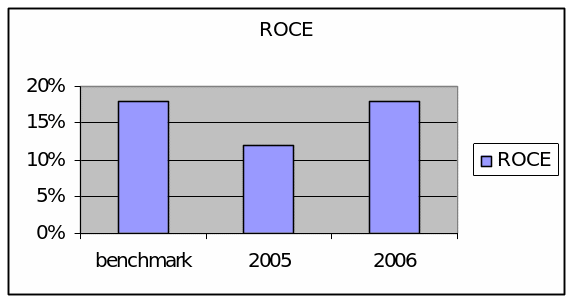
Return on Capital Employed (ROCE)
The ROCE ratio represents a company’s ability of earning a return on all of the capital that it employed. Thus the ratio is calculated by diving profit before interest & taxes or in short PBIT with capital employed. Capital employed is measured by the sum of ordinary capital reserves & shareholder’s fund along with total assets, deducted by short-term liabilities. In short, the equation will be-
ROCE = Capital Employed
It is better if a company gains this ratio higher enough, in case of low risk company; a low ROCE is acceptable but in case of high-risk companies, high ROCE is much preferred.
Analysis of the company- 1
From the information that have been collected from HBG’s financial statement, we can see that in year 2006, the company gained PBIT or simply operating profit of £15222 & the total shareholder’s fund amounted as 40745, total assets as 294770 & short-term liabilities as 248540, the company’s capital employed for the given year would be 86975. Thus ROCE = 18% which equals to benchmarks ratio. In the year 2005, HBG’s PBIT, shareholder’s fund, total assets & short-term liabilities were 11367, 45980, 232436 & 181356. So the ROCE in this year was 12%. So, from the above condition, we can state that the company is becoming enabled for the effective utilization of its funds & thus the ROCE situation is gradually improving.
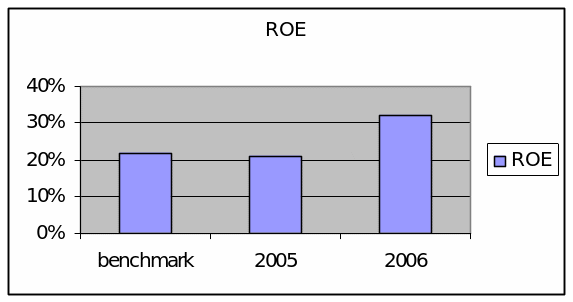
Return on Equity (ROE): The ROE ratio is the most “bottom line” accounting ratio that measures the return from the capital that has been employed in the business by calculating the profit after tax or PAT as a percentage of the share holder’s capital. This ratio can be varied from industry to industry. Hence the equation will be-
ROE = Profit after taxation or Net income / Shareholder’s find.
Analysis of the company-2
HBG gained a profit after tax of £ 13329 in 2006 & in 2005 £9870, while the company’s Shareholder’s fund in those years were 40745 & 45980. So the ROE was 32% & 21% respectively which are much higher than industry average of 22%. So it can be said that stockholders invest to a great return of their money & as this ratio is in upper position than benchmark ratio, it shows the extreme profitability of business.
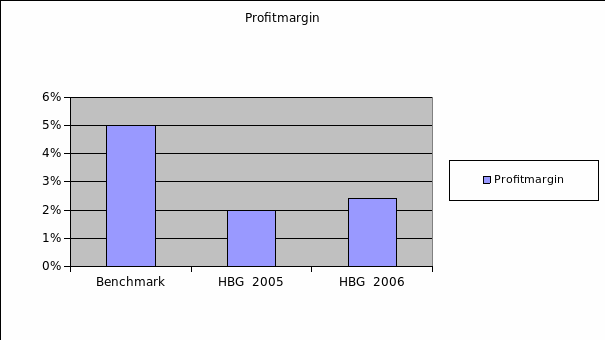
Profit-Margin ratio
This ratio expresses the company’s annual gross profit estimation in terms of total sales & operational percentage for the given period of time. Thus, the higher the ratio, the higher the company’s profitability & efficiency in the market. It is very useful while comparing companies in equal industries. The equation of calculating this ratio is-
Profit margin ratio = Profit before tax (PBT) / Turnover.
Analysis of the company-3
In 2006, HBG had a sales turnover of £790412 & in 2005 the amount was £731806, while in those years the company’s PBT was 19202 & 14191 respectively. As a result, the company’s Profit margin ratio was 2.42% & 2%, which are lower than benchmark ratio of 5%, but has an increasing trend over years. This shows that the company will need to earn better profit over its turnover rate.
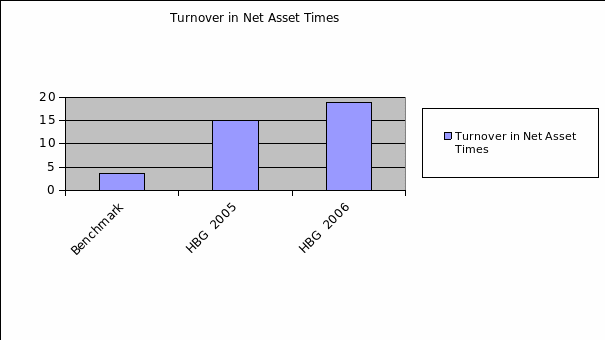
Net assets turnover ratio: This ratio indicates how efficiently a company is utilizing its assets by the use of sales turnover. So, the higher the net assets turn over, the more turnover for each unit of money invested, and according to this formula, the more profit will be generated. So,
Net assets turnover = Turnover / Net assets.
Analysis of the company-4
From the given information, we found that in 2006, HBG had a turnover of £790412 & in 2005 the amount was £ 731806. If the net assets in the mentioned years were 19 times & 15 times that is showing the company is effectively managing its assets as the benchmark ratio represents only 3.6 times turnover. So, HBG’s high net assets turnover rate places it as a good player of its total sales turnover & assets after liabilities.
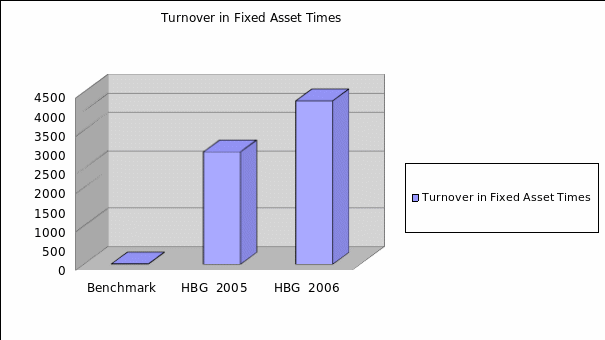
Fixed assets turnover ratio: This ratio shows how effectively the firm uses its plant & equipment, property & other tangible assets that are expected to be utilized by the company for more than a period in according to their usage life those are a part of non current assets. So the higher this ratio, the better the company’s ability of using the fixed assets. The formula is-
Fixed assets turnover ratio = Turnover / Fixed Assets.
Analysis of the company-5
We can notice that HBG had a very small amount of fixed assets as investment in the both year. In 2006, the amount was £185 (thousands) & in 2005 it was £249(thousands). So calculation of this tinny amount with a large scale of turnover, we have found 4272 times & 2938 times which merely seems unrealistic to compare benchmark ratio of 8.2 times. The extreme shortage of fixed assets is the reason of such outcome.
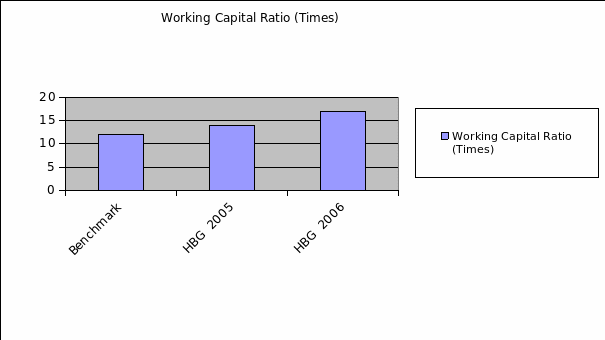
Working Capital Ratio: A Company uses working capital in order to fund their operations and purchase inventory. Working capital is calculated by deducting current liabilities from current assets. Thus this ratio reflects the company’s efficiency in handling cash with the amount of sales turnover. So, as high the ratio is, as the higher the efficiency of the company in cash handling respect. This ratio can be analyzed to indicate the relationship between the operational purpose money and the sales that has been generated from these operations. The equation is-
Working Capital Ratio = Turnover / Working Capital.
Company Analysis-6
In 2006, HBG had current assets of £294585 & current liabilities of £248540; similarly, in 2005 the same items were amounted as £232187 & £181356. So in 2006, working capital ratio was 17 times & in 2005 14 times while the benchmark ratio is 12.1 times. Thus, the company is becoming more skilled in generating profit & also generating a lot of turnovers compared to the money that is used for sales.
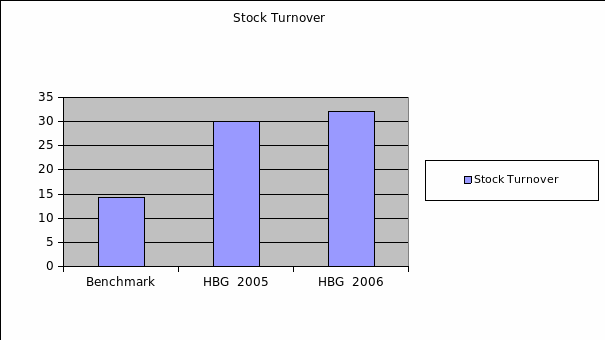
Stock Turnover Ratio: This is calculated by dividing sales turnover with shares outstanding as following-
Stock Turnover = Turnover / Stock.
The standard benchmark stock turnover ratio is 14.2 times while HBG’s position in year 2006 was 32 times & in 2005 30 times which are in much upper level that focusing the company’s capacity of adopting profitable turnover relative to the stocks.
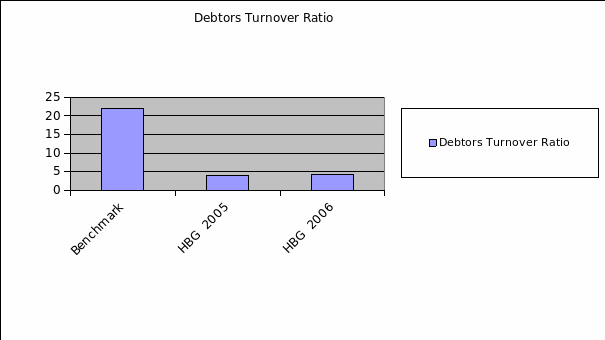
Debtors Turnover Ratio: Here debtors are expressed in terms of accounts receivables & others trade debtors.
Debtors Turnover = Turnover / Debtors
In 2006 the company’s debtor turnover was 4.26 times & 4.02 in 2005, which are much, lower than benchmark average of 22 times that is showing that the company is affected by bad payments where the customers are falling back in their commitment.
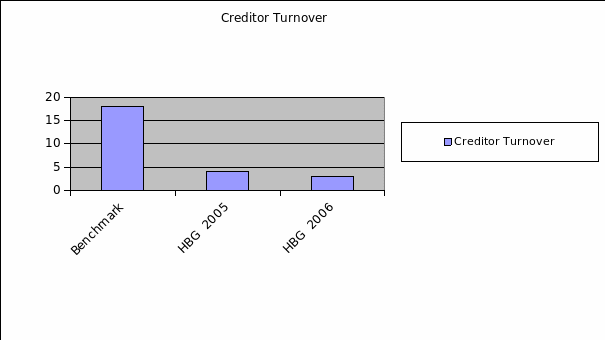
Creditors Turnover Ratio: Here creditors are expressed in terms of accounts payable & others trade payable.
Creditor Turnover = Turnovers / Creditors
In 2006, the company’s creditor turnover was 3.1 times & 4 times in 2005 which are at a decreasing trend that representing good situation when considering the Industry standards as the benchmark ratio is 18.1 times & the Debtors collection period.
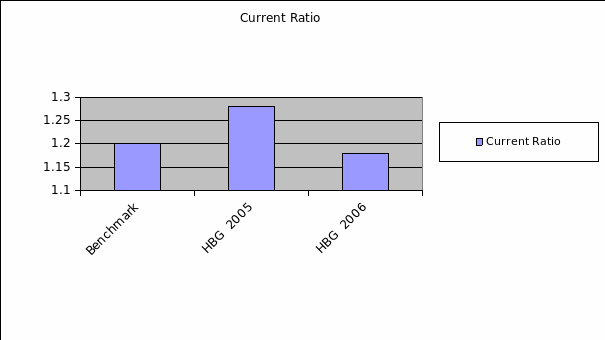
Current Ratio: This ratio measures the company’s ability to pay its debt when they arise. The equation is-
Current Ratio = Current Assets / Current Liabilities.
In 2006 HBG’s current ratio was 1.18 times & in 1.28 times 2005 & the benchmark ratio is 1.2 times. The upper trend of this ratio over industry average is demonstrating the company’s ability of covering its obligation to the creditors in a short period of time.
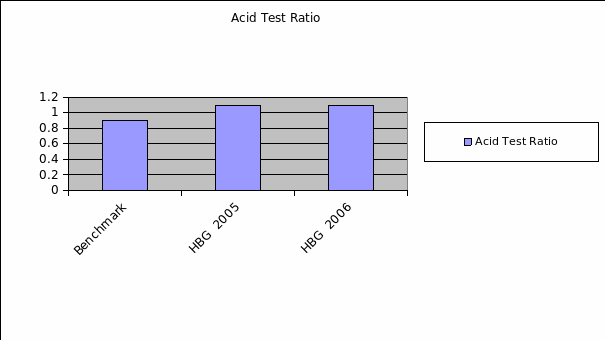
Acid Test Ratio: It is defined as short-term liquidity ratio. This ratio is more reserve than current ratio, & a more popular liquidity measure as it excludes stocks from the current assets. This ratio should be under 1.0 so the company is prepared to pay its liabilities when an unforeseen necessity arises. Equation is-
Acid Test Ratio = Current Assets – Stocks / Current Liabilities.
Company Analysis-7
In 2006 & 2005 the ratio was 1.1, which is slight upper than benchmark ratio of 0.90, so the company has available sufficient funds but it should manage it to come under 1.0.
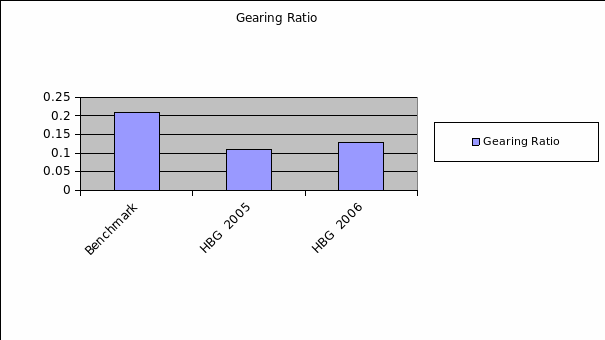
Gearing Ratio: It is the proportion to the financial risks that are associated with the use of debts. It is used to measure the reliability of the debts against the stockholder’s equity. Equation is-
Gearing Ratio = Interest Bearing Debts / Shareholder’s Fund
As we don’t have any particular information of company’s interest bearing debt, it is assumed that long-term creditors are relevant. So, gearing ratio in 2006 is 0.13 & in 2005 is 0.11 while benchmark ratio is 0.21, which is a positive sign for it.
Interest Cover: This ratio is used to examine the least profitability enough to pay of its interest expenses. The equation is-
Interest Cover = Profit before Interest & Tax / Interest Payments.
But in case of HBG, we cannot calculate this ratio, as the company had not published any amount of interest payments; there is information of interest receivable only. So, it is not possible to count.
Dividend Yield Ratio: This ratio is used to measure the amount of return that has been generated by a share that reflects in what extent the investors are being rewarded. Formula is-
Dividend Yield = Dividend per share / Market price pr share.
Here, the company’s dividend is presented for year 2006 at the amount of £18500 and as no dividend has been declared for 2005, the DPS for the declared year was 0.77 with 24000 of ordinary shares. Market price per share was 70.9, so the ratio is 1.1%, which is below standard of 6%.
Note: HBG’s current market price is 70.9.
Dividend cover ratio: This ratio expresses the company’s ability of paying dividends to the shareholders out of total profit earned. Thus, it shows the number of items that the dividend is covered by the available profit. Equation is-
Dividend Cover = Earnings per share / Dividend per share.
HBGs Earnings per share in 2006 was 0.55 & Dividend per share was 0.77 times, so Dividend cover was 0.71which is below than industry average of 2 times that shows the lack of creditable performance & thus the board needs to increase it.
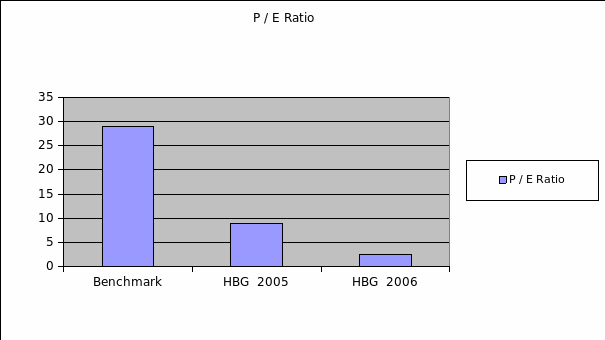
Price / Earning Ratio: It shows how much investors are willing to pay per unit of money of reported profits. Equation is-
P / E Ratio = Price per share / Earnings per share.
In 2006, the company’s price per share or PPS was £1 & earnings per share or EPS was £0.55. So, P / E Ratio was 9 times & in 2005 PPS & EPS were £1 & £0.41, so the ratio was 2.43 times which are mostly lower than benchmark ratio of 29 times & indicating that the company’s earning over shares are in a pessimistic position to invest & needs to recover. (Note: price per share is said to be 1 of 24000 shares outstanding)
Prospective Analysis
- By looking through the company’s overall position, it is said that ROCE, ROE, Net assets turnover etc ratios are in developing position although profit margin, dividend yield etc. position are not presenting a very reliable condition. So, the clients, sub-contractors, suppliers should give more chance to the company & do business with it.
- The investment position of this company is not very steady as price / earning ratio is low, debtor turnover position is risky, so the investors should invest carefully in this company.
- If a job seeker is trying to be a part of HBG, we must emphasise in it as the company provides its best effort to make efficient people whatever its financial position indicates.
Lastly, it can be said that HBG is one of the promising company in US construction market, without some drawbacks, its overall position is better & rising.
Bibliography
Brigham, E. F., & Houseton, J. F. (2004), Fundamentals Of Financial Management, 10th Edition, Thomson south-western, Singapore, ISBN:0-324-17829-8.
Bodie, Z., Kane, A. Marcus, A. J. (2002), Investments, 5th edition, Tata McGraw-Hill publishing Company Limited, New Delhi.
John, J., Leopold, W., Bernstein, A. & Subramanyam, K. R. (2001), Financial Statement Analysis, 7th edition, McGraw-Hill, Irwin.
Pandey, I. M. (2007), Financial Management, 9th Edition, Vikas publishing house PVT LTD, New Delhi, ISBN: 81-259-1658-X.
Report & Accounts, 2006, HBG Construction Limited, Web.
Appendix
HBG Construction UK
- ROCE = Return on capital employed
ROCE = PBIT / capital employed
Capital employed = share holders capital + long term liabilities + reserves = TA-CA = NA (4.745)

(175+24000+294770-248540) =21.62%
ROCE = Profit before taxation and interest / capital employed

Developed
- Returned on Equity (ROE) = PAT/NI – Common Equity/ Shareholder fund

- Profit Margin = PBT/Turnover

Low
- Net Asset Turnover = Turnover/Net asset

Much Higher
- Fixed Asset Turnover = Turnover/ Fixed Asset

- Working Capital = Turnover/Working capital
Working Capital = CA – CL = 294585 – 248540 = 46045

Raising
- Stock Turnover = Turnover/Stock

- Debtors Turnover = Turnover/ Debtors

- Debtors Turnover = Turnover/ Debtors

- Current ratio = Current assets/ Current liabilities

- Acid test Ratio = (CA- Stocks)/CL

- Gearing Ratio = Interest bearing debt/ Shareholder fund

- Interest Cover = PBIT/INT

- Dividend gield = Dividend per share/Market Price Per share
Dividend per share = Dividend paid /Shares outstanding = 18500/24000 = 0.77
- Dividend cover = Eps/Dps = 0.70
Eps = NI/CS = 13329/24000 = 0.55 = 0.55/0.77 = 0.71
- Price earning ratio = PPs/ Eps
PPs = 1
Rps = 0.55
1/0.55=9 (Below Standard).
Assume Market Price and Price per share are ₤1.