Introduction
Various kinds of Islamic debts have been exceedingly used as favoured modes of debt financing by Malaysian privately-owned companies in the last decade. This paper assesses the effect of security prices publication on privately-owned company’s stock returns (Modirzadehbami and Gholamreza 572). The data sample involves forty public firms engaged with issuing of Islamic debits during 2010. The abnormal returns (AR) and cumulative average returns (CAR) are computed and verified utilizing acceptable event evaluation method.
Event Description
An exclusive element of the Malaysian marketplace is the continuation of Islamic security price events. The securities are designed with a view of complying with Shariah practices, which do not allow interest charges. An Islamic security appeals to two extremely unique investment groups – those investing purely for faith motives, and ordinary people seeking instant, nicely charged guidelines for investing in and for spreading risks. Malaysian market was the first marketplace to experience a typical Islamic security event. Islamic bonds were already established in market by 1992 and widely spread to the world immediately.
The mutual security markets in Malaysia have increased widely in the last decade, with a standard expansion rate of roughly 22.5 % between 2009 and 2010 (Modirzadehbami and Gholamreza 574). Indeed, the outstanding quantity of security has exceeded the quantity of an ordinary debit capital in the local marketplace. This evaluation is basically based on the data from private debits pronouncements, and attempts to answer the questions related to: regression, computation of abnormal returns, calculation of the overall abnormal returns, and plotting and interpreting the nature of CAR graph generated before and after the event.
Stock Prices
Data regarding Islamic private debit concerns were derived from the Capital Commission record for a time period of three months before the event and three months after the event. Information on day to day final stock prices for three months prior to and after the Islamic bond event for all listed firms and for Kuala Lumpur Composite index abbreviated as KLCI was gathered from DataStream (Modirzadehbami and Gholamreza 573).
Simple Regression
In the model α and β value is approximated over the approximation time utilizing marketplace framework which compares the return of a single security with the returns of the entire market. The return on the KLCI is utilized as an alternative of marketplace returns. It is computed through regressing security returns alongside the marketplace results. The model for computing KCLI values is as indicated below.
Where
, and
Following estimation of the abnormal returns for the company, the abnormal returns for any other company are then computed (see table 1).
Abnormal Returns (AR)
The abnormal returns are described as the variation between the real returns and the ordinary returns for monitoring the trend of stock prices of companies utilizing the below equation.
Whereby E(R) denotes the anticipated returns, which is given by;
. Through averaging across other companies, the effect related to other events would be reduced. The x-sectional mean abnormal return for each time t, is given by the equation
Where N is the number of companies selected.
Table 1: Average Abnormal Returns from month -3 to month +3
Cumulative Average Abnormal returns (CAAR)
The CAAR for three months before and three months after are as indicated (table 2). Apart from Average AR, cumulative average AR is an essential statistical evaluation which aids in getting an intellect of the overall impact of the AR. In particular, the cumulative average AR can be very beneficial, if the effects of the event are not restricted purely to the event timeline (Modirzadehbami and Gholamreza 574). As indicated in table 2, cumulative average AR for the month -3 to month +3, are -0.01, -0.004, -0.005, -0.007, -0.009, 0.011, and -0.015 in that order. As illustrated, although t-tests for the timelines (-3,+3) and -3,0 indicate figures nearly significant, none of the t-statistics are completely significant based on 0.05 confidence level.
Table 2: Cumulative Average AR
CAAR graph and Interpretation
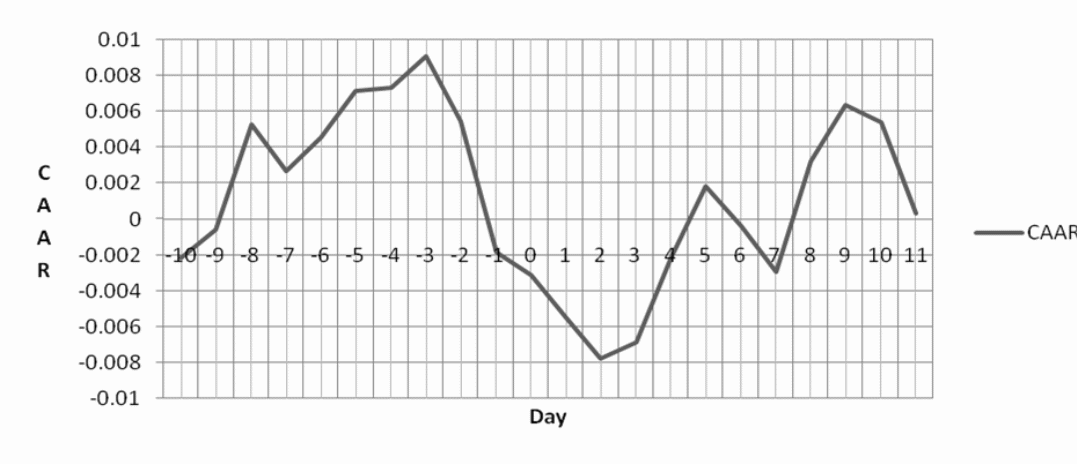
Based on figure 1, cumulative average abnormal return figures are absolutely positive prior to month -3 and after month +3. Negative cumulative average AR results for the months -3 to month +3 signify the negative analysis of Islamic security declaration through market stakeholders. Additionally, a decreasing pattern stretching from month -2 to month +1 of cumulative average abnormal returns can be viewed as an indication of abnormality in the marketplace if there is an overall positive pattern for the six months.

Work Cited
Modirzadehbami, Sahar and Mansourfar Gholamreza. “Information Content of Islamic Private Debt Announcements: Evidence from Malaysia.” Engineering and Technology 77.2 (2011): 572-578. Print.