Introduction
Because the public health exposure to airborne infectious agents remains a matter of acute concern, an experimental practicum was designed to expand the existing knowledge of infections. The practicum was initiated by the unit, whose mission is to advance the wellbeing of people in Ohio, as well as the global community, by creating and disseminating valuable knowledge. This unit was designed specifically to protect and enhance the individual and public health in Ohio and the rest of the nation, by encouraging multidisciplinary research. This research is intended to bring into focus and understand better the forces that currently impact public health and the mode of health care service delivery. The unit works to prepare the next generation for becoming and excelling as qualified public health practitioners and scholars, by developing collaborative ties with the government agencies and providing solutions to the existing and new public health problems. As such, the organizational unit envisions itself as a leader in public health research and education, and the discussed practicum reflects its commitment to its health research objectives. It is clear that the experimental practicum is directly related to the context of the entire organization, which is focused on conducting public health research as a means of generating new knowledge. The practicum was designed to close the existing gap in research and practice and, as a result, guide the Ohio and global communities in their quest for better health and improved wellbeing. The experimental practicum was initiated and carried out to reflect the values of diversity, excellence, equity, and ethics, which are the foundational pillars of the organizational unit and its activities.
Project Goals and Objectives
The purpose of the experimental practicum was to develop and test an apparatus and method for measuring aerosol generation associated with toilet flushing. To meet the goals of the project, a special chamber connected to a particle sizing spectrometer was created, in order to raise the efficiency of flush-related aerosol generation from toilets. Sampling was conducted in real-time, with the goal of refining the existing methods of sampling and measuring toilet flush-related bioaerosols that may be a potential source of public health hazards for humans.
The project was designed to address one of the most acute problems in public health – sustained presence of infectious agents in the air. Toilets are assumed to be relatively safe for use, but even the most sophisticated cleaning procedures do not guarantee the best result. Another reason justifying the importance of the practicum was that the body of published articles regarding the current knowledge of aerosol generation from toilets is extremely scarce. Several examples exist, such as Johnson, Lynch, Marshall, Mead and Hirst (2013), but they are not enough to explain the potential of toilets as a mode of transmission for airborne pathogens. The absence of valid and representative methods of research makes the situation even more complicated. As such, the importance of the practicum was justified by the urgent need to reduce the scope of infectious airborne agents affecting humans. However, at first, effective methods to evaluate the risks and scope of bioaerosolization in public toilets had to be developed. Therefore, the specific objective of the experiment was to develop and test an apparatus and method for measuring aerosol generation associated with toilet flushing.
To achieve the stated objective, a complex apparatus was designed, comprising a clear cylindrical plastic chamber with HEPA filtration system, an Aerodynamic Particle Sizer Spectrometer, a HEPA Allergen remover, and a Renegair® pump. The method required installing a chamber on two residential toilets. The proposed method had to help the researcher to keep particle counts low and detect and evaluate potentially minor increases in particle counts after toilet flushing. At the same time, the noise had to be minimal, in order not to lose a small signal. The instruments used during the experiment had to create the basis for developing a new method of bioaerosolization measurement and evaluation. Each instrument fulfilled a specific role. Holmes® True | HEPA Allergen Remover was used in the bathrooms to reduce particle concentrations in the background. Model 3321 Aerodynamic Particle Sizer® Spectrometer was used to measure small particle concentrations. The experiment was conducted in two half and one full residential standard bathrooms, as the setting was the most suitable for testing the effectiveness of the proposed method.
Results
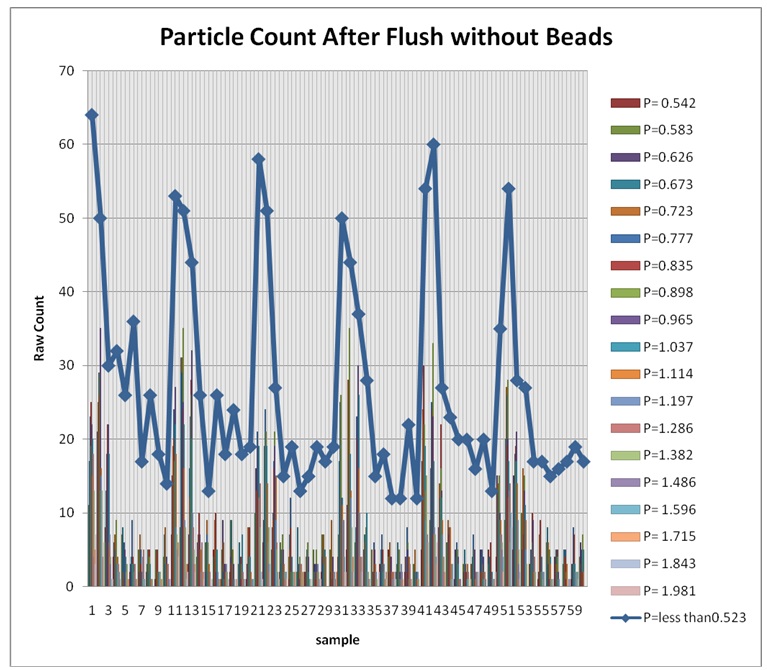
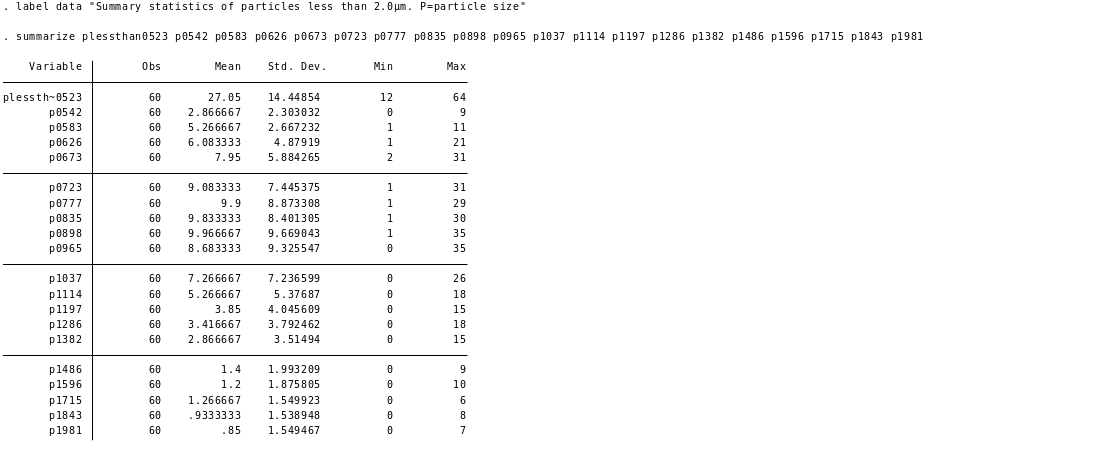
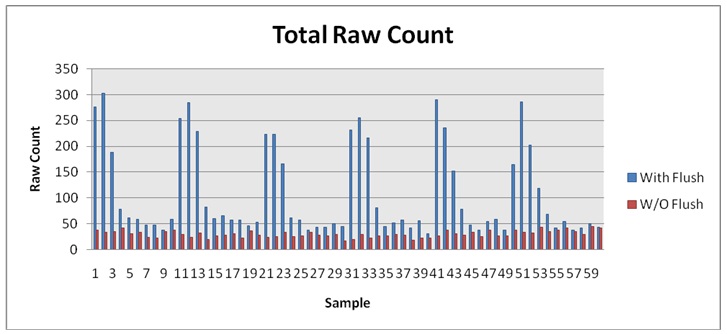
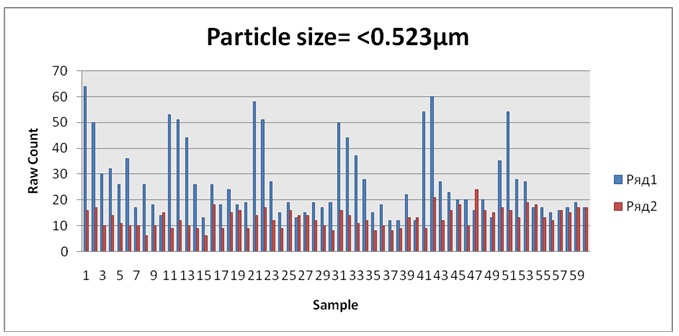
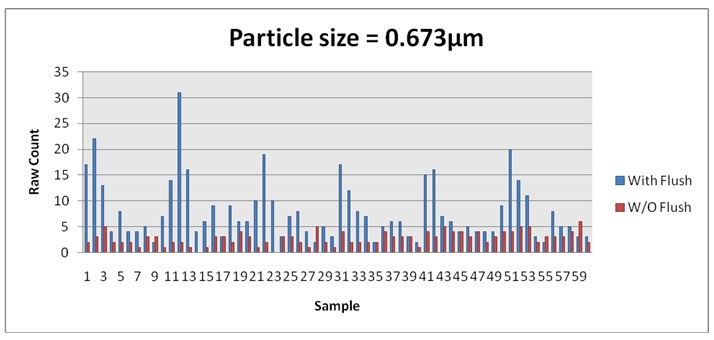
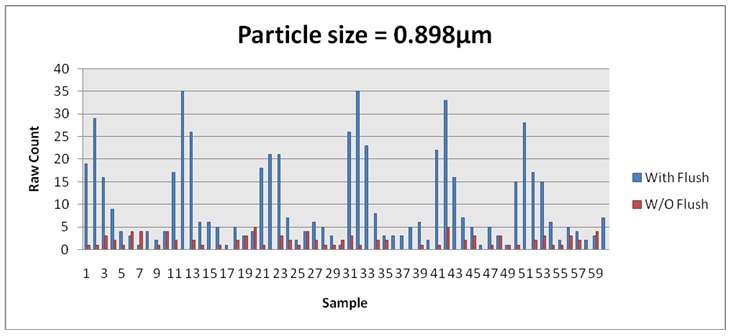
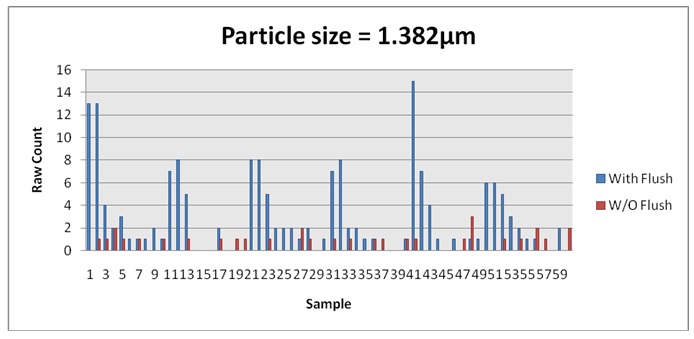
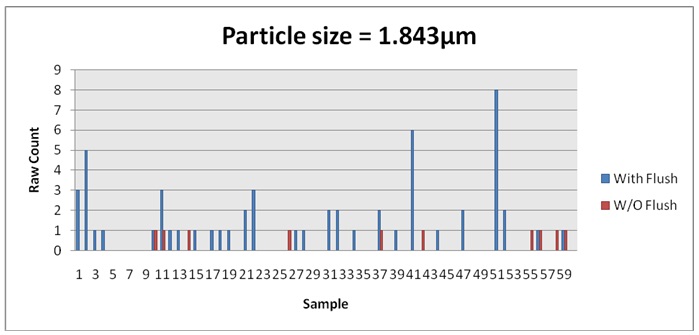
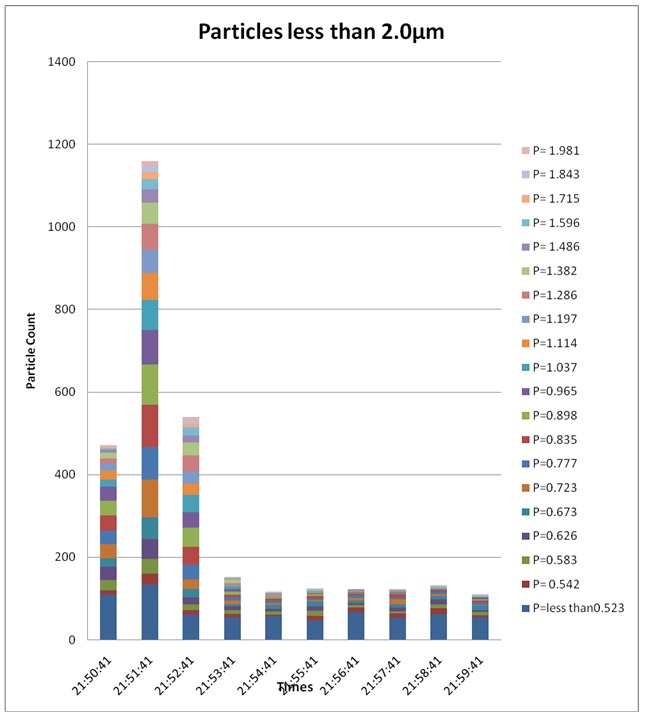
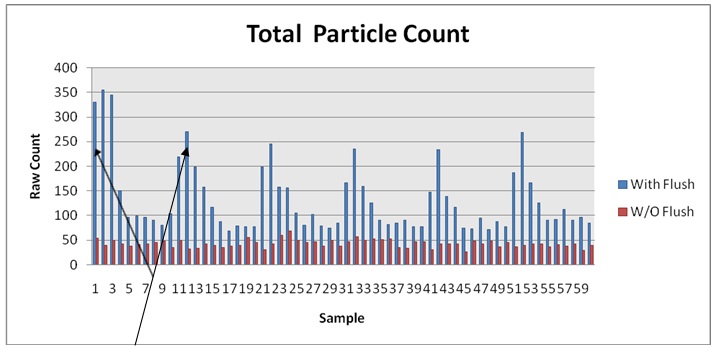
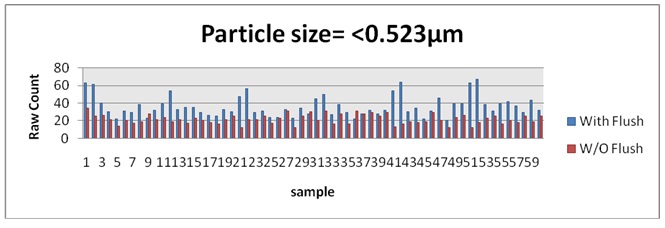
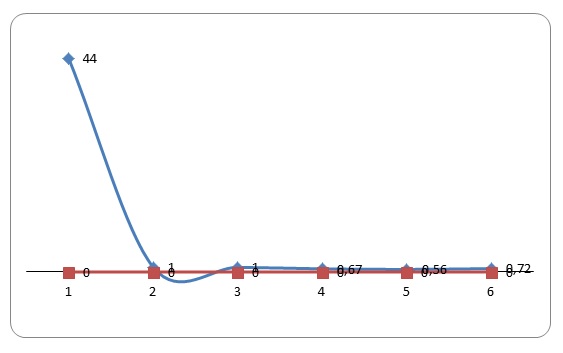
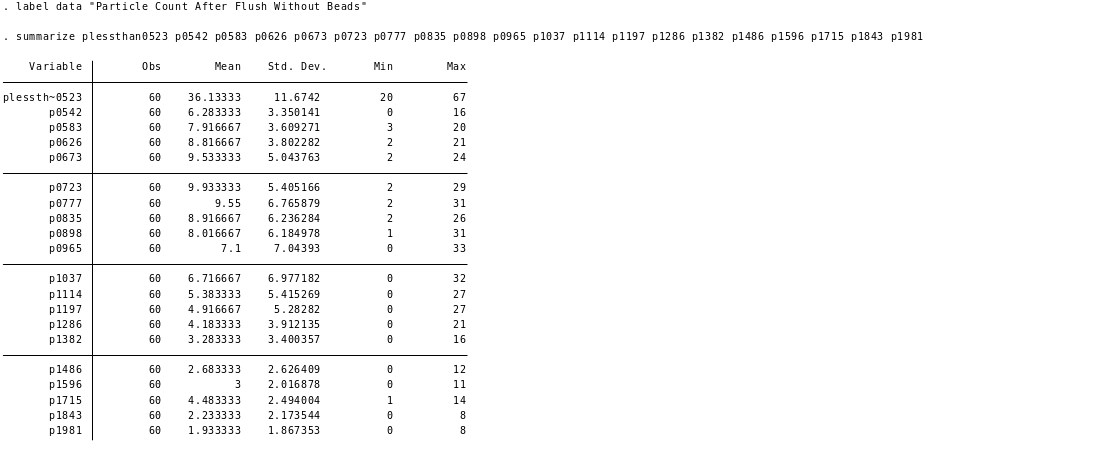
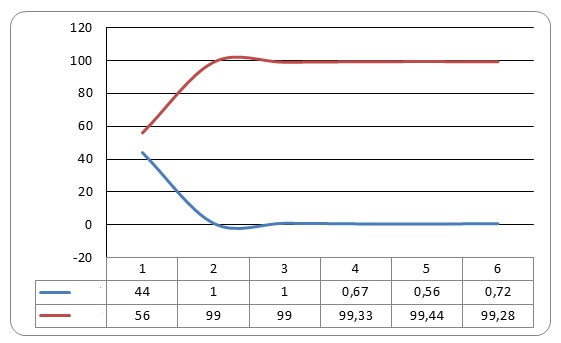
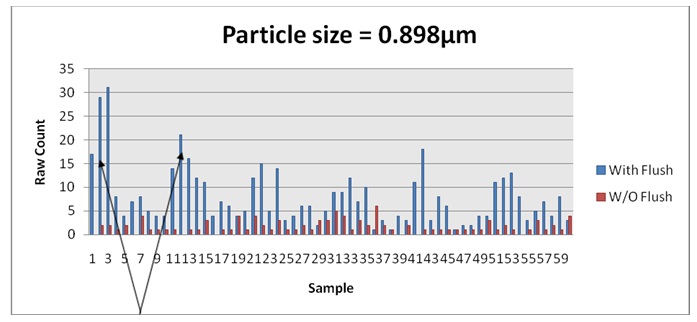
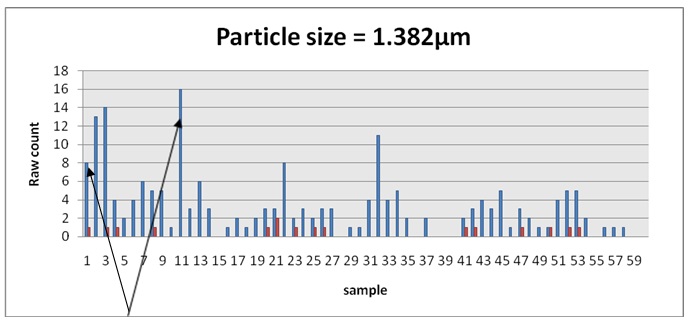
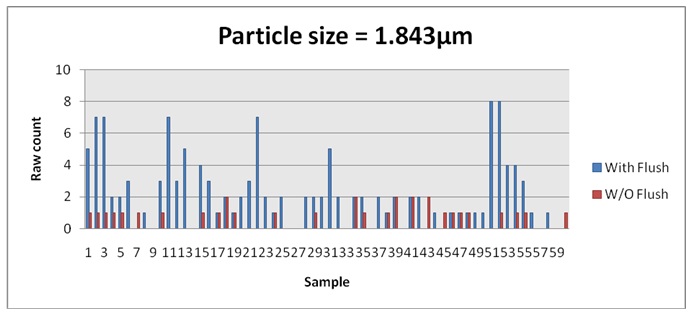
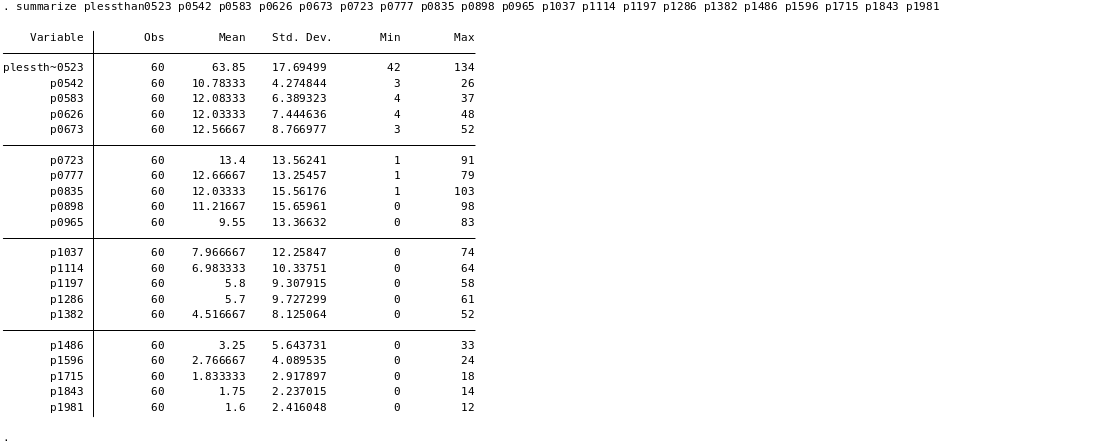
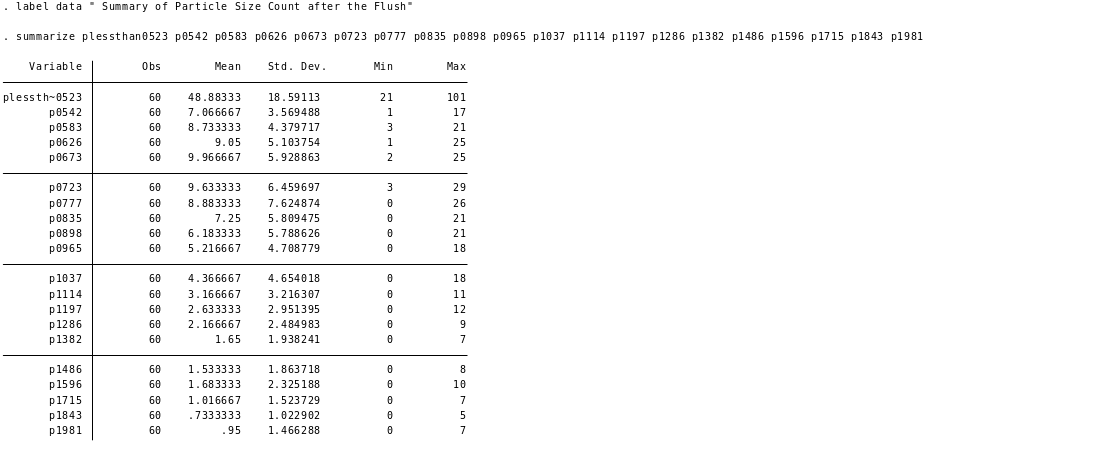
The results confirmed that the proposed method could potentially become a potent instrument of measuring changes in particle concentrations after toilet flushing. A total of four experiments were carried out, each leading to similar results. In the first experiment, a total of 60 samples were analyzed, with the data showing that toilet flushing generated aerosols. In the second experiment, the toilet was seeded with 0.05 µm polystyrene beads, and the method used revealed considerable increases in the number of particles after toilet flushing. In the third experiment, the results were similar to those obtained in the first two experiments. The fourth experiment was carried out in a different bathroom but still, the method used to measure particle counts revealed a significant increase in the particle concentrations after toilet flushing.
Certainly, these results alone cannot help to solve the existing public health issues and eliminate the risks of infectious diseases. Yet, it is clear that the practicum is directly related to public health. As mentioned earlier, resolving the existing infectious disease dilemmas is impossible without using effective methods to measure bioaerosolization in public and residential toilets. The proposed method can serve as a potentially valuable resource of useful information about particle concentrations and changes in particle counts before and after toilet flushing. As such, it can be used in combination with the measures adopted to reduce the concentrations of airborne infectious agents and test their efficacy. The only recommendation here is that the discussed method needs to be tested in a different setting, in order to confirm its validity and applicability.
It should be noted that the mere finding that pathogenic aerosols are generated through toilet flushing does not provide any helpful information as to how public health practitioners could control these processes. Therefore, the practicum is merely the beginning in the subsequent analysis of infectious agents, airborne infections, and dangers generated by public toilets. Future researchers will have to apply the proposed method in their analysis of bioaerosolization in public toilets.
Evaluation
The practicum has proved to be an extremely valuable learning experience. From the very first to the very last step of the experimental and data analysis procedures, the practicum was as a challenge that had to be faced and overcome. Given the paucity of research into the methods of measuring bioaerosol generation in public toilets, the practicum also served as an instrument of discovery, while the results confirmed that the experimental procedures and research efforts were not futile.
The practicum has exceeded all learning expectations, both in terms of the methodology and the analysis of results. Honestly, it appeared to be much more complicated than previously expected. The development of the research instrument and method was associated with numerous minor controversies. Even a slight mistake in the choice and design of the instruments would inevitably lead to wrong results. Thus, special care was taken with regard to the instruments used in the proposed method, their accuracy, quality, and reliability.
In many senses, the experimental practicum employed all possible classroom knowledge and skills, from creativity in designing the proposed method to the ability to collect and analyze primary and secondary empirical information. Moreover, a detailed analysis of the instruments and their potential contribution to the proposed method had to be performed. The main thing learned about public health practice is that it is a complex and multidisciplinary field that is full of research and practice voids. Emerging challenges demand the creation of new analytical methods. No one expects that the proposed method will address all questions and challenges in public health. Moreover, it is wrong to believe that the newly tested method will immediately eliminate all risks of airborne infections. The proposed method is just a step of transition between a better understanding of airborne infections and new strategies to reduce and control the scope of bioaerosolization through public toilets. It holds a promise to empower the local and global community with new equipment and skills to measure and control airborne infections generated and spread through public toilets.
Reference
Johnson, D., Lynch, R., Marshall, C., Mead, K. & Hirst, D. (2013). Aerosol generation by modern flush toilets. Aerosol Science and Technology, 47, 1047-1057.
Appendix 1
Experiment #1, Toilet 1






Appendix 2
Experiment # 2, Toilet 1 Flushes were treated with Polystyrene beads of 0.5µm






Appendix 3
Experiment # 3, Toilet 1. Flushes not treated with Polystyrene beads






Appendix 4
Experiment # 4, Toilet 2. Toilet flushed every ten minutes without polystyrene beads
