Introduction
Since its transition to a market economy in the early 1990s, Mongolia has demonstrated impressive results in terms of economic development, displaying a steadily increasing GDP and a respective decrease in national poverty rates. Nevertheless, despite this progress, the country’s economic development remains unstable due to limited diversification and recent adverse impacts on a global scale. As a result, some metrics, such as the Gini coefficient, demonstrate a lack of progress in terms of equality for the population. The following paper presents an analysis of three economic measures that illustrate the progress made by the country in recent years as well as challenges Mongolia has encountered in the process.
Analysis
The economy of Mongolia has undergone several major changes in recent decades. From a strategic perspective, the growth rate can be characterized as positive due to a substantial increase in GDP, from approximately $2.5 billion in the late eighties and early nineties to above $10 billion at the beginning of the 2010s (Index Mundi). However, it should also be mentioned that the growth rate of the GDP over the identified period was uneven, showing identifiable periods of stagnation and rapid growth.

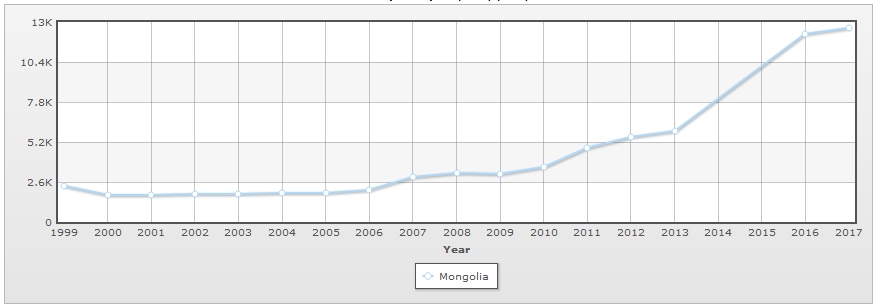
The most apparent instances of growth occurred in the early 1990s and early 2000s, with a massive slowdown in 2008 and 2009. On the other hand, GDP per capita has demonstrated a steady rate of growth, increasing from approximately $2,000 in the first half of the 2000s to $5,500 in 2012. Over the last five years, this variable has entered a phase of rapid growth, surpassing $12,000 in 2016 (Index Mundi). Such dynamics can be attributed to a number of factors. The first factor and, arguably, the most significant contribution to the development of the local economy was the transition to a market economy in the first half of the 1990s (“Mongolia Economy 2017”).
Prior to this transition, Mongolia facilitated trade primarily with the Soviet Union. As a result, many of the country’s social and economic domains such as medicine, gasoline, and advanced machinery remained dependent on aid from the USSR. To address the situation, the government started establishing connections with Western and Asian countries, followed by tax reforms and privatization. The initial phase of reform was associated with major inflation, growing unemployment, and food deficits. This period correlated with a significant decline in GDP per capita, from above $3,000 in 1990 to approximately $2,500 in 1993 (Index Mundi). While external factors, such as the surging prices of certain exported materials, had a positive influence on GDP growth, reliance on bank credit in the process of development undermined the banking sector, further disrupting the country’s economic stability.
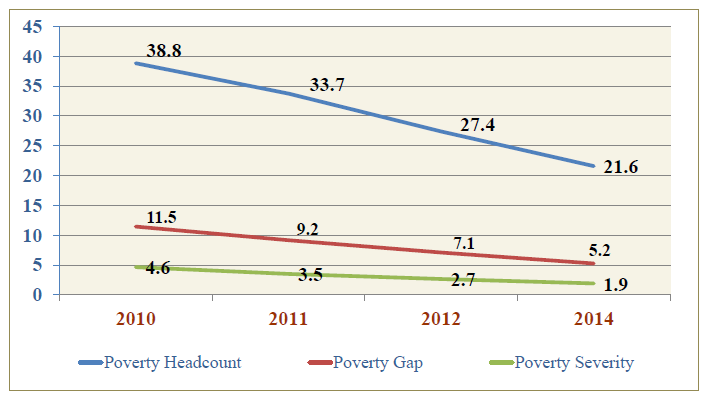
Poverty rate indicators for Mongolia are consistent with a rapidly developing economy. According to available data, poverty in the country is in decline, falling from 38.8 percent in 2010 to 21.6 percent in 2014. Similar dynamics have been observed in terms of a poverty gap reduction of 5.2 percent in 2014, more than a twofold decrease from the results shown in 2010, and poverty severity, which fell from 4.6 percent to 1.9 percent in the same period (Dandar). The observable steady decrease is consistent with the corresponding growth of GDP per capita identified above. However, despite this positive trend, poverty in the country remains high by global standards, currently placing Mongolia at number 80 among the countries of the world (“Population below Poverty Line”). For a country with medium human development, such a high rate is a major hindrance in terms of economic development potential.

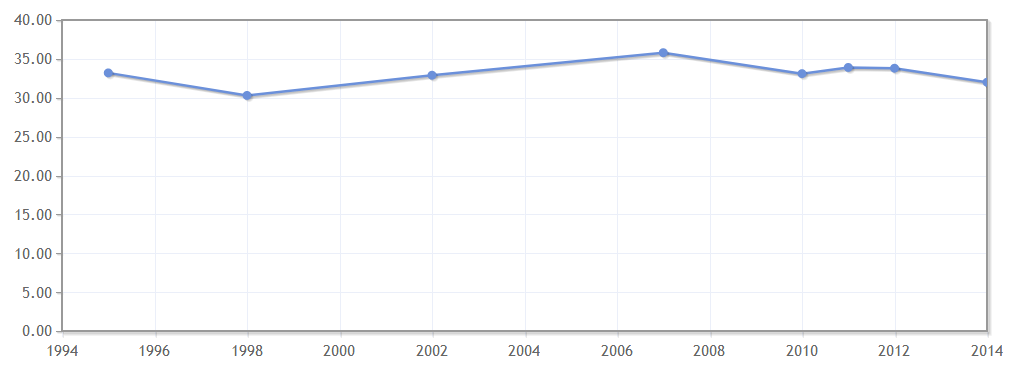
It should also be mentioned that despite the decrease in the poverty rate at a national level, the distribution of wealth among the population remains uneven. Specifically, the top 20 percent of the population with the highest income is responsible for approximately 40 percent of the total national consumption. At the same time, the poorest 20 percent consume no more than 7 percent (Eriksson). Since the indicator did not change significantly in recent years, it becomes evident that economic growth did not contribute to equality at a significant level in any practical terms. Income inequality can best be illustrated by the Gini coefficient, which ranges from total inequality (100) to absolute equality (0). As can be seen in Figure 3, the Gini coefficient in the identified period is relatively steady, ranging from above 35 in 2007 to 32 in 2014, with a record low of 30 in 1998 (World Bank).

Such stability indicates a lack of progress in terms of equality. In simple terms, while the economic well-being of an average citizen may increase as a result of economic development, wealth accumulates mainly in the hands of wealthy individuals, whereas the poor segment of the population remains at a disadvantage.
Conclusion
As can be seen from all indicators, Mongolia is currently on a path of steady economic improvement. Since the switch to a market economy in the middle 1990s, it has shown a steady increase in GDP per capita over two decades. Initially, growth was uneven, with numerous challenges in the domain of banking, a number of natural disasters, issues with international trade partners, and the onset of the Asian financial crisis. Currently, GDP per capita suggests that Mongolia can be considered a country with medium human development and an income in the upper-middle tier. Nevertheless, it is apparent that economic progress is still in the initial stages and cannot serve as a reliable indicator of the population’s well-being. The combination of a gradual decline in the poverty rate with a steady Gini coefficient suggests that increasing wealth does not correlate to a respective improvement inequality.
Works Cited
Dandar, Oyunchimeg. “Poverty Statistics in Mongolia.” National Statistics Office of Mongolia, 2016. Web.
Eriksson, Thomas. “Inequality in Mongolia.” UNDP, 2015. Web.
Index Mundi. “GDP – Per Capita (PPP) (US$).” Index Mundi, 2018. Web.
Theodora. “Mongolia Economy 2017.” Theodora, 2017. Web.
Theodora. “Population below Poverty Line (%) 2017 Country Ranks, by Rank.” Theodora, 2017. Web.
World Bank. “Mongolia – GINI index (World Bank estimate).” Index Mundi, 2015. Web.