Overview of the Problem
Problem
The main issue is the variation in the sales rates and the number of clients. Moreover, one should focus on the changes in the level of customer satisfaction. This variation indicates that the performance of the Phoenix Diner fluctuates significantly.
Purpose
The main goal is to understand the key areas which need improvement.
The main research questions
- What kind of improvements should the management bring in order to secure the loyalty of clients?
- What factors affect the level of customer satisfaction?
- What factors influence sales rates?
Hypothesis
It is possible to argue that the elements of the customer service affect various performance indicators.
The management of the Phoenix Diner focuses on several performance indicators, for example, the number of clients who visit this restaurant. Moreover, they pay attention to food and drink sales. More importantly, they attach importance to the level of their satisfaction with the services of this organization. These are the main issues that should be considered.
It should be noted that while collecting these data, the management did not try to test a particular assumption or a hypothesis. In order to do it, one should clearly identify dependent, independent, and control variables (McClave, Benson, & Sincich, 2011). Moreover, the managers overlooked some very important factors such as the work experience of employees. The hypothesis that has been identified has a significant limitation. In particular, it does not throw light on the impact of separate independent variables.
The Methods of Data Collection
- The management collected the data during 20 weeks. They observed the same variables such as sales rates or the number of clients. So, their survey can be viewed as a longitudinal study.
- They used a survey which prompted clients to rate the service on a ten-point scale.
- In particular, the lowest level of customer satisfaction was five thumbs down, whereas the highest level was five thumbs up.
It should be noted that organizations often prompt clients to rate the quality of services, and sometimes they rely on visual images such as thumbs instead of numbers. Yet, this approach can also enable a business to measure the attitudes of customers (Tinsley & Brown, 2000, p. 95).
Types of Data and the Level of Measurement
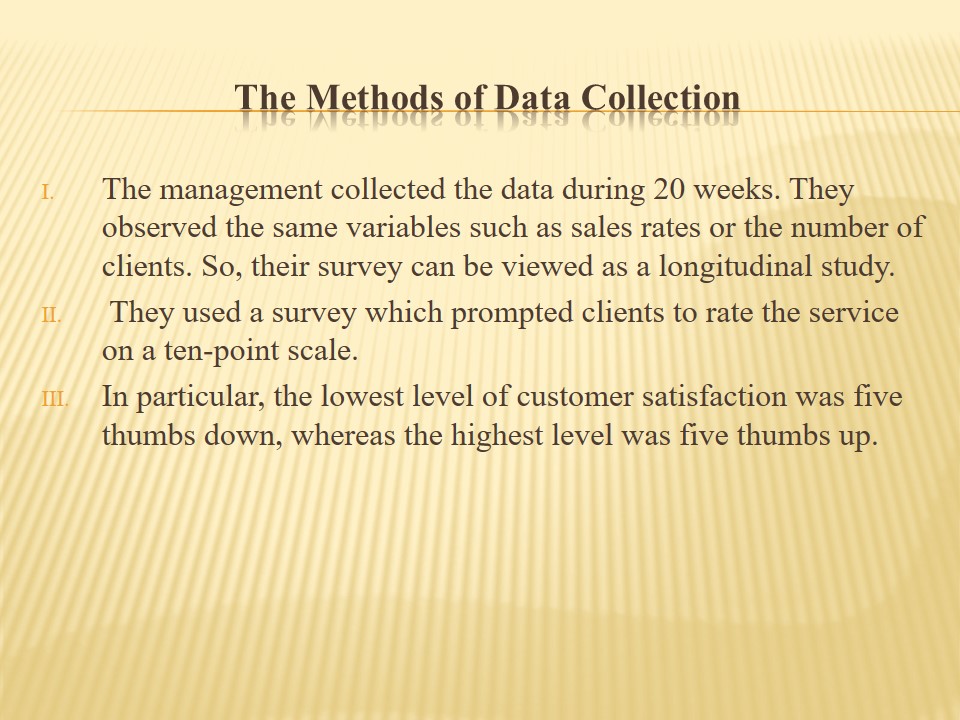
Therefore, this collected data represents the first three levels of measurement, in particular, nominal, ordinal, and interval.
Coding
The data can be presented with the help of a hierarchical coding. In particular, one can distinguish the following elements
- The elements of service:
- Entertainment;
- Nightly Special;
- Performance indicators:
- Sales:
- Food Sales;
- Beverages Sales.
- Number of visitors;
- The number of tables;
- Satisfaction.
- Sales:
The data can be divided into two mutually–exclusive categories, namely the elements of service and performance indicators. The first group will be measured at the nominal level. In turn, the second group will be measured at the ordinal and interval levels.

Appropriateness of Data
- The survey can throw light on the relations between the between dependent and independent variables such as the entertainment and the level of client’s satisfaction.
- Yet, several important indicators are missing, for instance, the number of employees or their work experience.
- Therefore, this survey does not throw light on every factor that shapes the opinion of clients.
Provided that the management examines only the variables that are presented in the survey, they can identify the relations between and independent variables. However, in this way, they may not gain a full understanding of the situation.
Reference List
McClave, J., Benson, P., & Sincich, T. (2011). Statistics for business and economics. Boston, MA: Pearson-Prentice Hall.
Tinsley, H., & Brown S. (2000). Handbook of Applied Multivariate Statistics and Mathematical Modeling. New York: Academic Press.