It appears logical to assume that higher unemployment levels are likely to result in greater rates of suicide. If that is true, it is important to investigate this relationship to be able to better identify individuals who are at risk of suicide to take the necessary preventive measures and provide them with assistance before they kill themselves, which makes it a worthwhile endeavor to investigate this problem. Therefore, the current paper examines the thesis that there exists a correlation between unemployment and suicide rates in the U.S. After presenting the data and providing a brief review of literature, the data is analyzed, and the findings are presented and discussed.
Data
The analyzed data includes the information on yearly suicide death rates per 100,000 population in the U.S., and the data on unemployment rates (percentage) in the U.S. The data about the suicide rates was obtained from Kochanek, Murphy, Xu, and Tejada-Vera (2016), and from and “Leading Causes of Death,” n.d. The data about the unemployment rates was gained from the Bureau of Labor Statistics (2017). The data about the years 1958-1969 and 1975-2014 (N = 52) is used because only the information for these years was present for both variables. The data should be representative of the general U.S. population; however, the data about unemployment is only about individuals aged 16 and more (Bureau of Labor Statistics, 2017), whereas the data on suicide rates pertains to individuals of all ages (Kochanek et al., 2016; “Leading Causes of Death,” n.d.). Table 1 below presents the data that was analyzed.
Table 1. The Data Used in the Current Analysis. Sources: Bureau of Labor Statistics (2017); Kochanek et al. (2016); “Leading Causes of Death,” n.d.
Literature Review
The problem of correlation between the levels of unemployment and suicide rates has been previously investigated in the research literature (Laanani, Ghosn, Jougla, & Rey, 2015; Milner, Page, & Lamontagne, 2014; Nordt, Warnke, Seifritz, & Kawohl, 2015). Although the debate about the causal relationship between unemployment and suicide has been taking place in the literature for a considerable amount of time, the findings of different researchers have not always been consistent (Milner et al., 2014).
For instance, Laanani et al. (2015), having analyzed data gathered in several Western European countries, discovered that there was a statistically significant increase of 0.3% in suicide rates for every 10% of increase of unemployment rates (95% confidence interval ranged from 0.1% to 0.5%) after statistically controlling for several potential confounders. It was concluded that, although there exists an overall statistically significant association between suicide and unemployment rates, this association is rather low in magnitude and varies across countries (Laanani et al., 2015).
Also, Milner et al. (2014) investigated the correlation between unemployment and suicide while accounting for such a potential confounder as the history of mental illness. It was discovered that unemployment is associated with a rather high relative risk (RR) of suicide (RR = 1.58, 95% confidence interval ranges from 1.33 to 1.83), but the RR dropped considerably after adjusting for the history of mental illness (RR = 1.15, 95% confidence interval ranged from 1.00 to 1.30; Milner et al., 2014). The authors concluded that it is difficult to plausibly interpret such findings due to the complex nature of the potential relationship between unemployment and suicide rates (Milner et al., 2014).
Nordt et al. (2015) also present some contradictory findings. The authors state that there was an association between unemployment and suicide rates; also, according to their most stable final model of the analysis of the data, greater suicide rates preceded an increase in unemployment rates with a lag of approximately half a year, and this relationship was not linear, because the effects were greater in magnitude when baseline unemployment rates were smaller (Nordt et al., 2015). However, the association between unemployment and suicide rates was discovered in the data collected during that study (Nordt et al., 2015).
All in all, the association between unemployment and suicide has been found in several studies, but the results were inconsistent. It is difficult to explain the causal mechanism (if any) between these two variables due to the complexity of the relationships between them, as well as because of a large number of potential confounders that are difficult to account for in analyses.
Methodology
The null hypothesis for the current analysis is as follows: “There is no correlation between yearly unemployment rates and yearly suicide rates.” For this analysis, the “default” α =.05 was used (Warner, 2013).
To test the hypothesis, the IBM SPSS Statistics software was used to calculate the Pearson’s product-moment correlation between the given variables. Furthermore, a linear regression was carried out, in which the unemployment rates were used as the independent variable, whereas the suicide death rates were used as the dependent variable. Before conducting the linear regression, it was tested whether the data meet the assumptions for this type of analysis (Laerd Statistics, 2013).
Results
Pearson’s Product-Moment Correlation
The results of the Pearson’s product-moment correlation analysis are presented in Table 1 below. As it can be seen, the correlation is statistically significant: R =.305, p =.028, two-tailed. Thus, the null hypothesis for the current analysis is rejected; the evidence was found to support the alternative hypothesis that there is a correlation between unemployment and suicide rates.
Table 2. Pearson’s Product-Moment Correlation for Unemployment and Suicide.
Linear Regression Assumptions
Before running a linear regression, it is paramount to check whether the assumptions for the regression test have been met by the data to ensure that its results will not be affected by some peculiarities of the data (Field, 2013; Laerd Statistics, 2013; Warner, 2013). The analyses that were run (see Appendix 1) indicate that most of the assumptions for the linear regression have been met:
- Both variables are quantitative (interval/ratio level of measurement).
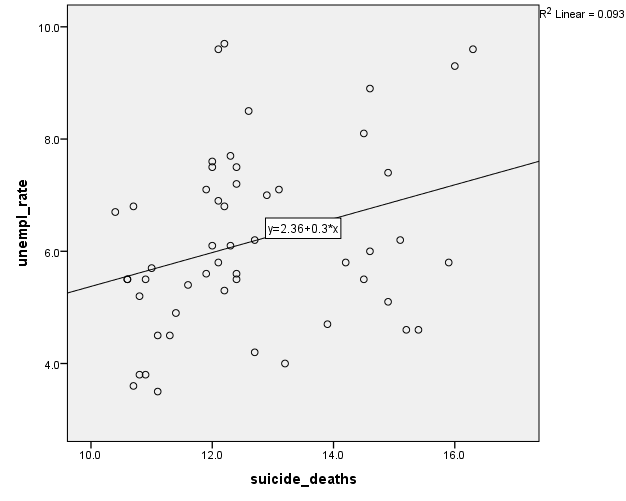
- There is no non-linear relationship between the variables, as can be seen from the scatter plot in Appendix 1, so the assumption is met.
- There is a positive auto-correlation between residuals, as indicated by the results of the Durbin-Watson test (0.533; see Appendix 1), which violates the assumption of no autocorrelation between residuals.
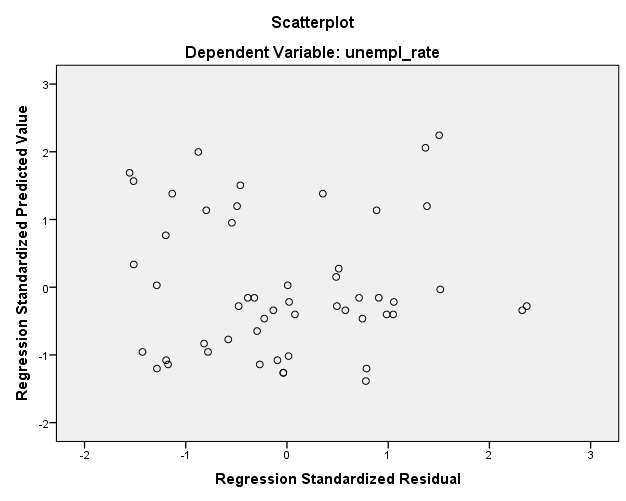
- Homogeneity of variances has been met, as can be seen from the scatter plot of residuals (see Appendix 1).
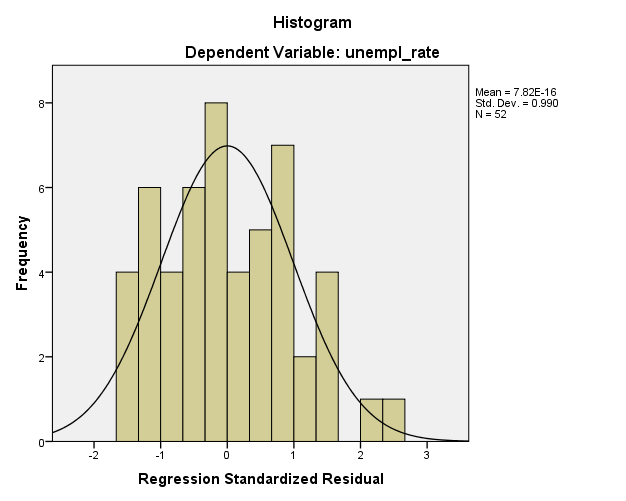
- Residuals are approximately normally distributed, as is apparent from the histogram (see Appendix 1).
- No multivariate outliers have been found. The procedure for checking for multivariate outliers using Mahalanobis distances was employed. The SPSS syntax for this procedure (IBM Support, n.d.) can be found in Appendix 2.
Therefore, one assumption has not been met: there is a positive auto-correlation between residuals, which could result in underestimated levels of significance of the regression (Field, 2013).
Linear Regression Results
The results of the linear regression are presented in Tables 3-5 below. It is easy to see that on the whole, the regression model is statistically significant: F (1, 50) = 5.134, p =.028, R2 =.093, adjusted R2 =.075; effect size as measured by the Cohen’s f2 =.1025 (small). It is also clear that in the current model, the rates of unemployment significantly predicted the suicide rates: β =.302, t (50) = 2.266, p =.028. This means that if the independent variable (unemployment rates) changes by 1 standard deviation, this will be associated with the change of.302 standard deviations in the dependent variable (suicide rates).
Table 3. Model Summary.
Table 4. The ANOVA Table.
Table 5. The Results of Regression Analysis.
Also, it should be stressed that because this is a univariate analysis, β ≈ R (the difference of.003 is probably due to rounding), and p-values for the regression and the Pearson’s product-moment correlation analysis are equal (Field, 2013; Warner, 2013).
Limitations
The current analysis has several limitations. First of all, due to the unmet assumption (the positive auto-correlation between residuals), the p-values for the analysis might be not trustworthy. Second, although the regression model was significant, it is still a correlational analysis only, and it does not permit making any conclusions about the causation between unemployment and suicide due to the very nature of the correlational research design; only experimental studies (which are impossible in this case for multiple reasons) or perhaps longitudinal research (to a limited degree) might allow for making causal inference (Warner, 2013). Third, the current analysis does not take into account the numerous possible confounders for the correlation, nor does it analyze any potential mediators or moderators between unemployment and suicide.
Conclusion
On the whole, it was found that unemployment rates and suicide death rates are correlated. The Pearson’s product-moment correlation was statistically significant: R =.305, p =.028. The regression model was also significant: F (1, 50) = 5.134, p =.028, R2 =.093, adjusted R2 =.075; effect size as measured by the Cohen’s f2 =.1025 (small). Unemployment rates significantly predicted suicide death rates: β =.302, t (50) = 2.266, p =.028. This allowed for rejecting the null hypothesis; the evidence was found to support the alternative hypothesis that there was a correlation between suicide death rates and unemployment rates.
Future studies might further explore the nature of the relationship between unemployment and suicide. The current study only uses correlational design, which does not allow for causal inference. In addition, the nature of the relationship between unemployment and suicide (the direction, confounders, mediating or moderating variables, etc.) still remains unclear nowadays.
References
Bureau of Labor Statistics. (2017). Labor force statistics from the current population survey. Web.
Field, A. (2013). Discovering statistics using IBM SPSS Statistics (4th ed.). Thousand Oaks, CA: SAGE Publications.
IBM Support. (n.d.). Compute Mahalanobis distance and flag multivariate outliers. Web.
Kochanek, K. D., Murphy, S. L., Xu, J., & Tejada-Vera, B. (2016). Deaths: Final data for 2014. National Vital Statistics Reports, 65(4), 1-122. Web.
Laanani, M., Ghosn, W., Jougla, E., & Rey, G. (2015). Impact of unemployment variations on suicide mortality in Western European countries (2000-2010). Journal of Epidemiology and Community Health, 69(2), 103-109.
Laerd Statistics. (2013). Linear regression analysis using SPSS Statistics. Web.
Leading causes of death, 1900-1998. (n.d.). Web.
Milner, A., Page, A., & Lamontagne, A. D. (2014). Cause and effect in studies on unemployment, mental health and suicide: A meta-analytic and conceptual review. Psychological Medicine, 44(5), 909-917.
Nordt, C., Warnke, I., Seifritz, E., & Kawohl, W. (2015). Modelling suicide and unemployment: A longitudinal analysis covering 63 countries, 2000-11. The Lancet Psychiatry, 2(3), 239-245.
Warner, R. M. (2013). Applied statistics: From bivariate through multivariate techniques (2nd ed.). Thousand Oaks, CA: SAGE Publications.
Appendix 1
Results of testing whether the assumptions for the linear hypothesis have been met are presented below.
The scatter plot for the independent and dependent variables

The Durbin-Watson test
The scatter plot of residuals

The histogram for the regression standardized residuals

Appendix 2
Syntax that was used for checking for multivariate outliers (IBM Support, n.d.):
REGRESSION
/MISSING LISTWISE
/STATISTICS COEFF OUTS R ANOVA
/DEPENDENT year
/METHOD=ENTER suicide_deaths unempl_rate
/CASEWISE PLOT(ZRESID) OUTLIERS(3)
/SAVE MAHAL (md2).
compute p_md2 = 1 – cdf.chisq(md2,2).
compute mv_outlier = (p_md2 <.001).
exe.