Wine and Brandy Shipments in Australia Case Study

Exclusively available on IvyPanda Available only on IvyPanda

This paper will study the domestic sale of Australian brandy by winemakers for the period of September 1989 to June 2014. Australia Bureau of Statistics (par. 2) provides data on brandy sales collected every quarter. The following is a set of 100 raw data about brandy sales in Australia measured in thousand liters of alcohol.

We will write a custom essay on your topic a custom Case Study on Wine and Brandy Shipments in Australia
808 writers online
PeriodBrandy SalesPeriodBrandy SalesPeriodBrandy SalesPeriodBrandy Sales
Sep-1989447Dec-1996313Jun-2004130Dec-2011125
Dec-1989370Mar-1997183Sep-2004161Mar-201282
Mar-1990491Jun-1997212Dec-2004173Jun-201283
Jun-1990305Sep-1997278Mar-2005114Sep-201296
Sep-1990485Dec-1997293Jun-2005128Dec-2012125
Dec-1990304Mar-1998184Sep-2005150Mar-201371
Mar-1991413Jun-1998219Dec-2005179Jun-201373
Jun-1991242Sep-1998235Mar-200690Sep-201394
Sep-1991337Dec-1998279Jun-2006117Dec-2013113
Dec-1991286Mar-1999179Sep-2006130Mar-201460
Mar-1992231Jun-1999212Dec-2006162Jun-201489
Jun-1992298Sep-1999215Mar-2007110
Sep-1992386Dec-1999289Jun-2007108
Dec-1992354Mar-2000157Sep-2007127
Mar-1993255Jun-2000176Dec-2007188
Jun-1993317Sep-2000194Mar-200883
Sep-1993403Dec-2000301Jun-2008109
Dec-1993370Mar-2001244Sep-2008126
Mar-1994241Jun-2001162Dec-2008153
Jun-1994287Sep-2001189Mar-200989
Sep-1994279Dec-2001226Jun-2009117
Dec-1994353Mar-2002127Sep-2009118
Mar-1995272Jun-2002159Dec-2009147
Jun-1995284Sep-2002179Mar-201072
Sep-1995298Dec-2002209Jun-2010107
Dec-1995333Mar-2003117Sep-201098
Mar-1996223Jun-2003146Dec-2010133
Jun-1996259Sep-2003171Mar-201185
Sep-1996279Dec-2003208Jun-2011100
Mar-2004109Sep-201199

Source: Australia Bureau of Statistics (Tables 2).

  1. A set of 100 raw data of brandy sales is tabulated above.
  2. The frequency distribution and histogram of brandy sales for Australia are illustrated below.
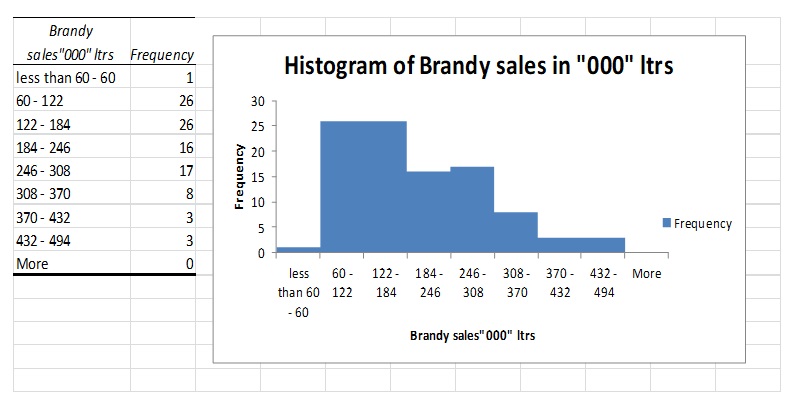
Histogram of brandy sales for Australia

  1. The histogram has a tail that stretches to the right hence can be classified as a distribution that is skewed to the right. This means that few sales were made within classes that had more liters. As an example, there were few sales in the class of 432-494 compared with the class of 60-122.
  2. The mean, median, and mode are displayed on the summary table of descriptive statistics below:
Brandy sales
Mean202.81
Standard Error10.13856
Median179
Mode117
Standard Deviation101.3856
Sample Variance10279.04
Kurtosis-0.02322
Skewness0.779482
Range431
Minimum60
Maximum491
Sum20281
Count100

Mean = 202.81

median = 179

mode = 117

  1. Sample standard deviation and variance are also tabulated in descriptive statistics above.

Standard deviation = 101.3856

1 hour!
The minimum time our certified writers need to deliver a 100% original paper

Sample variance = 10279.04

  1. Median is the most appropriate measure of central tendency for skewed distribution. This is supported by the fact that the distribution contains outliers, which tend to temper with the mean. A comparison of mean, median, and mode for positively skewed distribution shows that mean is the highest value among the three measures hence the outliers will have a great effect on the mean compared with the median. This is why the median is applied as a measure of central tendency. In the case of a normal distribution, the mean is used as a measure of central tendency given that it does not contain outliers.
  2. The coefficient of variation for the sample is obtained as follows:

coefficient of variation = σ/i = 101.3856/ 202.81 = 49.99

CV = 50

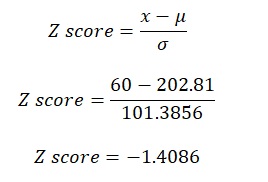
    1. Z-score for minimum value:

Z-score for minimum value

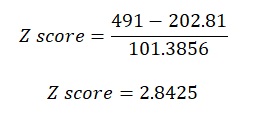
Z score of maximum value

Z score of maximum value

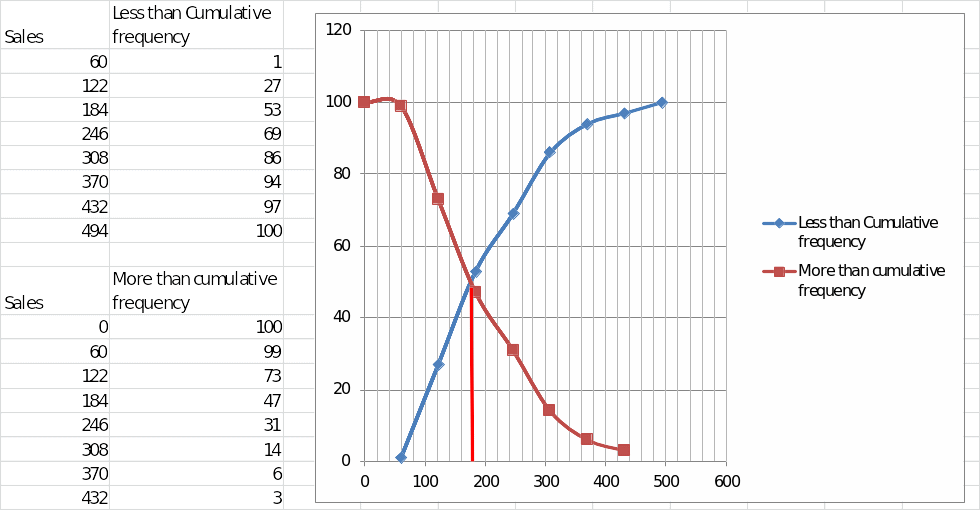
  1. Ogive for the distribution and median
According to the Ogive curve drawn above, the median is 180.

According to the Ogive curve drawn above, the median is 180.

Remember! This is just a sample
You can get your custom paper by one of our expert writers

Works Cited

Australia Bureau of Statistics. Shipments of Wine and Brandy in Australia by Australian Winemakers and Importers. Cat. No. 8504.0, ABS, Canberra, 2014. Austats. Web.

Print
Need an custom research paper on Wine and Brandy Shipments in Australia written from scratch by a professional specifically for you?
808 writers online
Cite This paper
Select a referencing style:

Reference

IvyPanda. (2022, July 21). Wine and Brandy Shipments in Australia. https://ivypanda.com/essays/wine-and-brandy-shipments-in-australia/

Work Cited

"Wine and Brandy Shipments in Australia." IvyPanda, 21 July 2022, ivypanda.com/essays/wine-and-brandy-shipments-in-australia/.

References

IvyPanda. (2022) 'Wine and Brandy Shipments in Australia'. 21 July.

References

IvyPanda. 2022. "Wine and Brandy Shipments in Australia." July 21, 2022. https://ivypanda.com/essays/wine-and-brandy-shipments-in-australia/.

1. IvyPanda. "Wine and Brandy Shipments in Australia." July 21, 2022. https://ivypanda.com/essays/wine-and-brandy-shipments-in-australia/.


Bibliography


IvyPanda. "Wine and Brandy Shipments in Australia." July 21, 2022. https://ivypanda.com/essays/wine-and-brandy-shipments-in-australia/.

Powered by CiteTotal, best essay referencing tool
If you are the copyright owner of this paper and no longer wish to have your work published on IvyPanda. Request the removal
More related papers
Cite
Print
1 / 1