Restriction of Lambda DNA in the Laboratory Essay (Critical Writing)

Exclusively available on IvyPanda Available only on IvyPanda
Updated: Jan 4th, 2024

Introduction

Deoxyribonucleic acid (DNA) is an important biological molecule. It contains a set of coded genetic instructions. It is one of the most important molecules as far as living organisms are concerned. It is noted that the molecule has a double stranded helix structure. The set of instructions contained in the DNA molecule are important for various reasons. One of them is controlling the functioning and development of all living organisms.1[1662] DNA is also responsible for controlling the function of many viruses, both beneficial and harmful to living organisms. As such, one can argue that the DNA is a crucial molecule in sustaining life on the planet. It is an important subject of study, with many scholars and scientists seeking to carry out further research on it. Scholars and researchers apply new techniques in studying the molecule with the aim of gathering more information on how it works.

We will write a custom essay on your topic a custom Critical Writing on Restriction of Lambda DNA in the Laboratory
808 writers online

There are many bacterial viruses discovered by researchers and scholars specializing in the study of DNA. Bacteriophage lambda is one such bacterial virus discovered through these studies. The virus commonly infects the Escherichia coli bacteria species. Just like any other virus out there, the structure of lambda phage consists of various basic components. They include, among others, a capsid, a tail, as well as a tail fibre. The DNA in the head of the virus has a unique structure. It has a double strand and is circular in shape. The virus binds to its host, usually the Escherichia coli bacteria. It infects the host by injecting the DNA contained in its head into the bacteria’s cytoplasm. The injection is achieved through the use of its tail.2[20706] The lambda DNA undergoes a series of replications inside the bacterial cell. The serial replications have a number of effects on both the host and the virus. For example, the replication leads to the formation of many particles of the virus. In rare situations, the phage DNA can exhibit unique characteristics. For example, it can embed itself onto the chromosomal structure of the host cell. The DNA that is already integrated within the host cell is referred to as the prophage. When it is in this form, the DNA poses no harm to the host cell.

A restriction enzyme is used for various purposes as far as the DNA is concerned. For example, it is used for the purposes of cutting DNA at a point or location near the restriction site. Restriction sites refer to a specific nucleotide sequence found in a DNA molecule. The restriction site is used for the purposes of recognizing a particular DNA molecule.3[1050] The restriction enzymes are commonly found in bacteria and archaea species. To date, scholars and researchers working in this field have discovered and documented over 3000 restriction enzymes. Advances in biotechnology have enabled scientists around the world to synthesize over 600 enzymes in laboratories under a controlled environment. Such technological advances have made the commercial production of the enzymes a viable venture. The enzymes form part of the organism’s defense mechanism, helping it wage war against viruses attempting to invade it. The process through which the restrictive enzyme selectively cuts up a foreign DNA molecule is referred to as restriction.

Gel electrophoresis, on the other hand, refers to a technique used for the purposes of separating and analyzing macromolecules. In addition to the macromolecules, the technique is used to separate and analyze macro fragments.4 A set of criteria informs the separation of these macromolecules. For example, the separation may be carried out on the basis of the macromolecule’s size, as well as the charge that they contain. A number of macromolecules are analyzed using this technique. They include DNA, ribonucleic acid (RNA), and proteins.

The technique, for instance, plays an important role in the separation of DNA fragments from a population based on their length.4[225] In most cases, an electric field is applied on the target macromolecule. The aim is to move molecules with a negative charge. The molecules are moved through an easily cast gel. The shorter molecules are observed to move faster than the longer ones. As a result of this difference in speed, the former move further compared to the latter. The reason is that the shorter molecules find it easy to pass through the spaces in the gel.

Materials and Methodology

The following are the materials used and the methodology adopted for this project:

Materials

15 sets of materials were used in this procedure. They included 0.8% agarose solution and 125ml Erlenmeyer flask. In addition, 50X TAE, a microwave, a stop watch, and 50ml graduated cylinder were used. Other materials included 1ml/ml of ethidium bromide, distilled water, 1 × EDTA, and λ DNA (0.1 µg/µl). A loading dye, 2× restriction buffer, and restriction enzymes from Escherichia coli, BamH1, and Hind111 were also used. Finally, dH2O and 4 1ml tubes were used.

1 hour!
The minimum time our certified writers need to deliver a 100% original paper

Methodology

The procedure was carried out systematically as follows:

Setting up a restriction digest

4 1.5ml tubes were labeled B, E, H, and -. After the labeling, the tubes were placed on a test tube rack. 4 µl of λ DNA was added into each reaction tube. 1 µl of the Escherichia coli was added into the tube labeled E. Further, BamHI was added into tube B and HindIII into tube H. The tubes were then closed and put inside a microwave. The bacteria were then put in a water bath for about 20mns. Freezing was carried out after incubation.

Casting an agarose gel

Prior to the preparation of the gel, the casting tray was inserted into the electrophoresis chamber. The tray was put into the chamber with the orange gaskets against the side walls. The comb was placed into the first set of slots. The slots are located at the top of the tray. During these procedures, the researcher made sure that one can clearly read 1.5 on the left side of the comb when placed properly in the tray. 40 ml was the volume of agarose gel solution needed for the purposes of this procedure.

The right quantity of agarose to make a 0.8% solution was measured out and placed in a 125ml Erlenmeyer flask. During the measurement, it was determined that agarose gels are cast as a percent weight per volume solutions (%w/v). For example, 100 mls of a 2% (w/v) solution is 2g/100ml. An appropriate amount of 50X TAE was added into the flask so that the final concentration was 1X. 35ml dH2O was then added into the flask and the contents swirled gently. The flask was then placed in the microwave and heated for 1 minute. After heating, the flask was removed, swirled gently, and put back into the microwave for an additional 30 seconds.

After heating, the flask was allowed to cool for 2 minutes before its contents were poured into a 50ml graduated cylinder. The volume of the flask was brought to 40mls through the addition of dH2O. The gel solution was returned back into the flask. 1µl of ethidium bromide was added into the combination. The researcher took caution when handling ethidium bromide as it is a hazardous substance. For example, the substance is a known mutagen and a suspected carcinogen. As a result of this, gloves were worn when handling it. The gel solution was then poured into the casting tray and allowed to sit for 15 minutes for it to solidify. The gel turned opaque with a slight blue hue when it was ready.

Cast 0.8% agarose gel

The openings of the tray were sealed using a tape. After this, a comb was inserted. Agarose solution was then added into the casting tray. The added solution was the right quantity to fill the depth of about 5mm. The solution was then allowed to set. After this, the tape sealing the tray was broken. The tray was placed on the platform created using the gel box. Caution was taken to ensure that the comb was placed on the cathode. The comb was then gently removed, taking caution to ensure that the walls were submerged. The box was then covered.

Load gel and separate by electrophoresis

1 µl of the loading dye was added into each of the reaction tubes. The loading dye was then mixed with the contents of the reaction tubes. 10 ml of the content from each of the reaction tubes was then loaded into a separate well in the gel. The openings of the electric boxes were sealed. The lids were then connected to power. After this, power was released for 1hr at 100 volts. Power was then turned off and the whole arrangement disconnected. After this, the tray was taken out of the electric box. The gel was slid into a disposable weight boat and the tray labeled. The trays were then stained and viewed.

Remember! This is just a sample
You can get your custom paper by one of our expert writers

Results

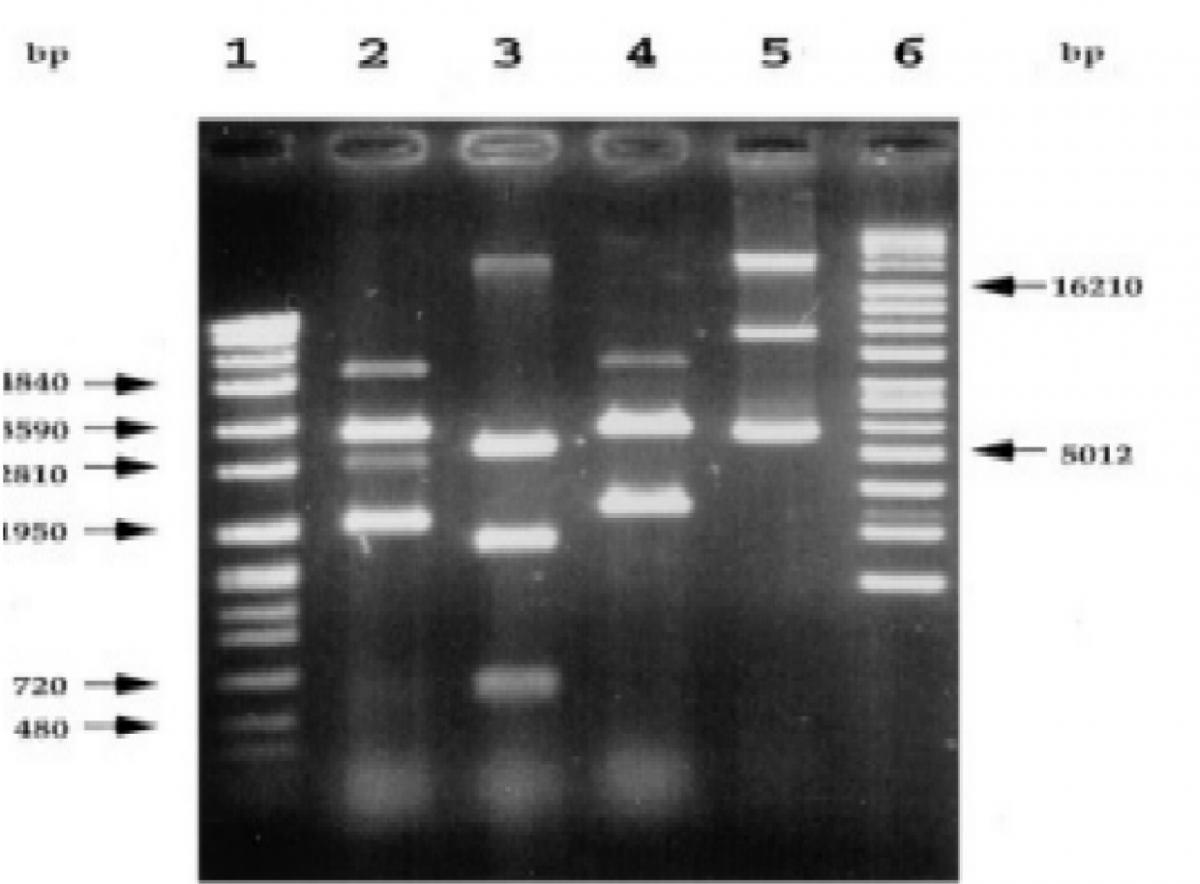
Below is a diagram showing the results obtained from the experiment:

Results obtained from the experiment
Diagram 1. Results obtained from the experiment. Source: Author.

HindIII=23130bps

Lane 1 shows the results obtained from the tube containing DNA without an enzyme. The lane shows results for DNA at around 23000 base pairs (bps) and greater. Lane 2 contains BamHI. 5 bands are observed at just under 20000bps. Based on HindIII tube, the bands are between 9416bps and 6557bps. The other one is at around 6557bps, while the 4th is less than 6557bps and closer to 5000bps.

Lane 3 contains E. Cori and has 5 bands. One band is located roughly at 23000bps and another between 9416bps and 6557bps. A third one is located just under 6557bps and a fourth one just below the third. The fifth band is less than 4361bps, but greater than 2322bps. Lane 4 shows the results for the tube containing HinDIII. There were 8 cuts made at 23130bps, 9416bps, 6557bps, 4361bps, 2322bps, 2027bps, and 564bps. Lane 5 is the test enzyme and appears similar to lane 2. The two lanes (5 and 2) have the same number of cuts of similar sizes and at similar positions.

The bands are spaced differently, showing the inverse log scale that they follow. In addition, the large sized enzymes are brighter than the small sized ones. Two dark regions are observed on the diagram where the loading die was located. Lastly, lane 6 contains 3 regions, one close to 21000bps, another right below it, and the last one located around 6000bps.

Discussion

Lane 4, which contained HindIII, acted as the guide for the sizes of DNA cut. HindIII is normally consistent and acts as a reliable guide when comparing results obtained from different procedures. It is noted that in the lane, it is only seven bands that are observed clearly as the other one is too small and most probably run off the gel.4[228] Because of the inverse log scale of the cuts and the percentage of agarose used, it is hard to separate the two large cuts. As a result of the consistency achieved from HindIII lane, it is easy to determine where the cuts by the other enzymes were made.

The first lane contains uncut lambda DNA. It is easy to determine this since only one band is observed in the lane. The lane contained no enzyme to act on the DNA. In the case of lane 2, BamHI was expected to have six bands, but only five are shown in the results. The results may be due to the fact that two pairs of the expected cuts, 5505bps and 5626bps, as well as 6527bps and 6770bps, are so close to each other. The proximity of the cuts to each other makes them appear as one. The results are similar to those observed in the mystery enzyme. Therefore, a conclusion is made that the enzyme is BamHI.

For lane 2 that contains E Cori, the expected number of fragments is 6, but only 5 are showing.3[1049] The two bands located at 5643bps and 5804bps are viewed as one big and bright band located just below the 6557bps point of HindIII. The last lane contains the experimental enzyme used in the experiment. Three bands are observed, the first at roughly between 23130bps and 48502bps. The second one is located just below 20000bps and above 9416bps. The last band is observed at just below 6557bps at around 5500bps. The enzyme matches the action of BSa1, which produces fragments at 31291bps, 11418bps, and 5793bps.4[241]

We will write
a custom essay
specifically for you
Get your first paper with
15% OFF

There are two reasons as to why some bands are darker than others. The first reason is that the larger fragments contained more ethidium bromide than the smaller ones because there were more places for it to be inserted.3[1053] As a result, the larger fragments are brighter compared to the smaller ones. The second reason is that the dark regions were produced by the loading dye, which bleached out some of the florescence of the ethidium bromide.

Conclusion

Biotechnology has enabled researchers across the globe to identify a number of enzymes based on their actions on DNA. The gel electrophoresis technique plays an important role in conducting these studies as shown in the current experiment. The test enzyme in the experiment shows results that are similar to those observed in BamHI. The results are similar to those observed following the application of BSa1, which produces fragments at 31291bps, 11418bps, and 5793bps.4[241] The conclusion made is that the enzyme under investigation is BSa1.

References

Kitano R. Systems biology: a brief overview. Science. 2008; 295: 1662–1664.

St-Pierre F, Endy D. Determination of cell fate selection during phage lambda infection. Proc Natl Acad Sci. 2008; 105: 20705–20710.

Bourniquel AA, Bickle TA. Complex restriction enzymes: NTP-driven molecular motors. Biochimie. 2002; 84: 1047–1059.

Williams RJ. Restriction endonucleases: classification, properties, and applications. Mol Biotechnol. 2003; 23: 225–43.

Print
Need an custom research paper on Restriction of Lambda DNA in the Laboratory written from scratch by a professional specifically for you?
808 writers online
Cite This paper
Select a referencing style:

Reference

IvyPanda. (2024, January 4). Restriction of Lambda DNA in the Laboratory. https://ivypanda.com/essays/restriction-of-lambda-dna-in-the-laboratory/

Work Cited

"Restriction of Lambda DNA in the Laboratory." IvyPanda, 4 Jan. 2024, ivypanda.com/essays/restriction-of-lambda-dna-in-the-laboratory/.

References

IvyPanda. (2024) 'Restriction of Lambda DNA in the Laboratory'. 4 January.

References

IvyPanda. 2024. "Restriction of Lambda DNA in the Laboratory." January 4, 2024. https://ivypanda.com/essays/restriction-of-lambda-dna-in-the-laboratory/.

1. IvyPanda. "Restriction of Lambda DNA in the Laboratory." January 4, 2024. https://ivypanda.com/essays/restriction-of-lambda-dna-in-the-laboratory/.


Bibliography


IvyPanda. "Restriction of Lambda DNA in the Laboratory." January 4, 2024. https://ivypanda.com/essays/restriction-of-lambda-dna-in-the-laboratory/.

Powered by CiteTotal, online referencing generator
If you are the copyright owner of this paper and no longer wish to have your work published on IvyPanda. Request the removal
More related papers
Cite
Print
1 / 1