Map comparisons
The Canadian population is adhered to the South owing to numerous reasons that trace back to the ancient migration patterns, industrial revolution, climatic conditions, and urbanization. As highlighted in the introductory statement, the spatial population pattern of Canada is skewed towards the South Eastern region partly because of early migration pattern.
This region represents the first habitat of European immigrants (1942) who owe their reasons for the mass exodus to several push and pull factors that include fertile land and favorable climate among others. As such, with enough human resource and technical know-how the region evolved along two fronts simultaneously; becoming industrialized and urbanized.
To this effect, the then cities within this place were well served with communication networks inform of railways and roads, and teeming with activities consequently burgeoning and hence attracted more and more people as opposed to other regions of Canada (Schaefer 302).
Moreover, the harsh climatic conditions of the North (humid and cold climate with short cool summers) are the reasons why the South dwarfs the North in population density.
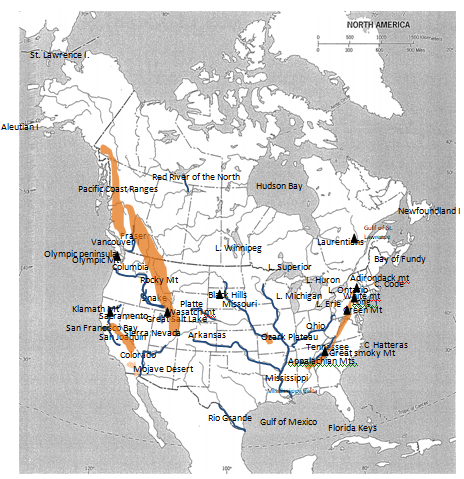
The spatial population distribution of North America is related to the physiographic pattern of the region to a greater extend. On comparing the maps in figures 3-2 and 3-19 a correlation between the two can be drawn. On observing the land terrain along latitude 400 as portrayed in figure 3-2 it is apparent that majority of the population reside at the lowlands below 2500 meters, and a few along the sea shores.
With a wide area of land on the West characterized by high altitudes then it follows that it exhibits sparse population. Thus, a majority of the population is biased towards the East. The population is avoiding highlands in favor of plain lowlands.
From the dispersal patterns as exhibited by figure 3-7 it is apparent that from the 19th to 20th century the population has been moving towards high atitude regions from the sea shores. This is evident by the increase in population in most Central States of Kansas, Missouri and Oklahoma among others. The population moves from the Eastern States and coastal States of New Jersey and Delaware among others.
On observing figure 3-8 of North American Manufacturing belt it is evident that most industries are located towards North East and Eastern region of the US. On comparison to figure 3-14 of fossil fuel deposits it is evident that the two are correlated. The major manufacturing belts fall within the major fossil fuel reserves vital in running these industries at reduced running costs.
Moreover, the belt falls within regions rich in industrial raw materials i.e. the corn and cotton belts among others. To boost its growth the region is served with international harbors that are open to Europe and the rest of the World. Moreover, the large population provides a ready market to already finished products (MacLeod 690).
Figure 3-14 represents the major fossil energy reserves of North America. There are three major fossil energy reserves with coal and gas taking a lions share relative to oil. The major States that produce coal include:
Montana, North Dakota, Wyoming, Idaho and Utah. On the other hand, the major states producing coal include: Arkansas, Missouri, Iowa, Louisiana, Indiana, Ohio, Kentucky, West Virginia, Mississippi and Michigan. Finally, the major states with oil reserves are Louisiana, Mississippi, Oklahoma and Michigan (Kimble 602).
Map 1: North America’s physical geography

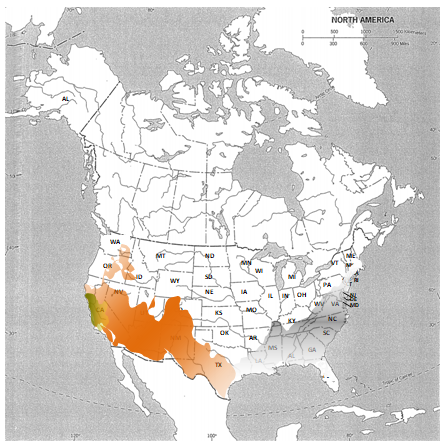
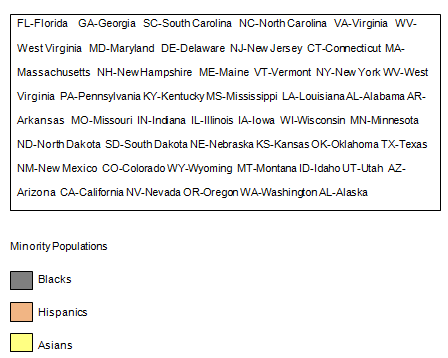
Map2: The United States and the major concentrations of minority populations


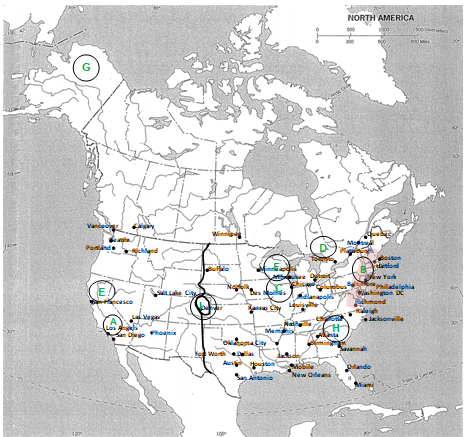
Map 3: United States Major Cities and Economic Regions

KEY:
A-Silicon valley
B-Atlantic Seaboard Megalopolis
C-Corn Belt
D-Main Street Conurbation
E-Pacific Hinge
F-Dairy Belt
G-Alaska North Slope
H-Research Triangle
I- Boundary between Arid and Humid America.
Works Cited
Kimble, Hebert. “The Inadequacy of the Regional Concept” London Essays in Geography 2.17 (1951): 601-617. Print.
MacLeod, George, and Jones Mother. “Renewing The Geography of Regions.” Environment and Planning 16.9 (2001): 669-706. Print.
Schaefer, Frankline. “Exceptionalism in Geography: A Methodological Examination.” Annals of the Association of American Geographers 43.3 (1953): 298-305. Print.