Executive Summary
This study was commissioned by the World Vision Australia (WVA) organization. The purpose of the study was to find out the perception and attitudes of Western Australia residents towards charitable organizations and the World Vision brand. The residents of Western Australia (WA) were segregated into segments consisting of similar demographics. The survey instrument used in the study was a questionnaire that was mailed directly to the residents of Western Australia who were involved in this study.
The survey instrument consisted of both close-ended and open-ended questions that were to be filled by the respondents. Data was analysed and presented in tables and charts. Clustered sampling was adopted whereby the demographic segments of the population were used as clusters for the purposes of this study.
Throughout this study, it has been established that the majority of WA residents do not support WVA and other charitable organizations currently. It is important to note that majority of WA residents have stable sources of income to enable them support WVA; however, they are currently not supporting it, but are willing to support it in the future. To this end, WVA has to conduct campaigns and sensitization programs to enable WA residents identify with World Vision brand. It is also recommended that WVA advertise and market its brand actively in order to increase brand awareness.
Introduction
A research methodology is basically a systematic way to help solve a research problem. It is a scientific way of conducting research (Cresswell & Miller 2000). A research methodology assists in understanding the logical steps that are used in conducting a research.
Problem Definition
Since 2007, public giving to international development NPOs has flat-lined, just keeping up with inflation. Statistics “suggests that we are getting richer, and at the same time, tighter with our money” (F. Fourie, personal communication, March 2, 2015). WVA has seen a steady decline in its on-going pledge support (child sponsorship, child rescue and donations) over the last five years. WVA hopes that the BUS3100 Research Project will help it to reach its 2021 goals which are outlined below:
To aspire to contribute to the sustained well–being of 20 million children To grow the income base to AUD $ 1 billion To actively engage 1 million supporters
In 2011, Western Australia brought in 20 % of the on-going pledge program targets nationally through retail campaigns, but that has dropped to 11 % in 2014. WVA would like to know what is holding people back from committing to on-going giving (pledge programs) to World Vision Australia.
How the Study Was Administered
This study was administered using questionnaire with both close-ended and open-ended questions administered to the respondents. It was a survey that targeted Western Australian (WA) residents. The main aim of this paper was to find out the Western Australian residents’ perception and attitude toward charity and support. According to Springer (2013), a survey is adopted to fit to the scope of the study.
A survey design focuses on a few selected aspects from a given population. A few selected aspects are used to represent the entire population. Wieland and Handfield (2013) define a survey design as a strategy or plan for undertaking research that is often used due to its low cost, and it is easy to access information while using multiple sources of evidence. It is further noted that the survey design is of particular interest when one wishes to gain a richer understanding of the process being enacted and the context of the research. Businesses, governments and media spend vast resources while researching about the perceptions of people.
Accurately conducted research generates high revenue as opposed to poorly done research whose cost is high and could even bring governments down economically. A survey design, therefore, is a valuable tool for assessing trends and opinions (Myers, 2013). Study surveys which are carefully designed often change business plans and strategies even when the scope of such surveys is limited.
Sampling Method
A sample consists of a few selected aspects from the entire population. Sampling, therefore, is the process of identifying a few members to be included in the sample so as to represent the entire population (Trauth, 2001). Before sampling, a sampling frame is devised. Sampling is the only process possible, especially when the population is infinite. In this study, clustered sampling was adopted. Clustered sampling is applied in regional or geographical sampling. With clustered sampling, a large population is subdivided into subgroups which bear similar characteristics. These subgroups are referred to as clusters.
First, as compared to census method, the cost of using a sample is low. With sampling, the quality of study is better since it increases the probability for better data collection. Sampling also provides faster research results as compared to a census (Gummesson, 2000). Moreover, some situations require sampling since at the end of research some objects of the study end up being destroyed. This means that if census method was adopted for the study, it would result in the destruction of all the objects of the study at the end of the research. Therefore, sampling is the only process possible especially when the population is infinite. In this study, clustered sampling was adopted.
Clustered sampling is applied in regional or geographical sampling (Stanway, 2015). With clustered sampling a big population is divided into subclasses known as clusters. A cluster is, therefore, “defined as a segment of the population consisting individual elements with similar features” (Warf & Barney, 2007). Predetermined boundaries are used to subdivide the area in which the study is to be conducted, for instance, using existing administrative boundaries as is in this case.
A few clusters are then picked to represent the entire population depending on the sample size required. When done efficiently, clustered sampling provides an unbiased estimate of the parameters of the population. In this study, two conditions fostered the use of cluster sampling. One was the need for more efficient and economic means of sampling and the other was the unavailability of a frequent sampling frame for the individual elements (Warf & Barney, 2007).
To understand the perceptions and attitudes of WA residents, clustered sampling was applied in this study. The administrative boundaries of WA were used as the study clusters due to similarity of the individual elements in those clusters. The survey instrument, therefore, was mailed directly to the respondents in all those clusters as developed by the administrative boundaries in WA. The statistical efficiency for this was usually lower as compared to simple random sampling.
This is due to the fact that clusters were homogeneous in the same block. After identification of those clusters, simple random sampling was adopted to make samples from each cluster. This provided adequate data for analysis while also enabling different research procedures to be used in different clusters. The decision to use clustered sampling was derived from Minkov (2007). According to Minkov (2007), clusters are treated as sampling units.
The sampling frame for this study included people from personal circles such as friends, siblings, neighbours, friends, colleagues and university students who were all over 18 years of age and had lived in WA for a period of more than three years. This was to ensure that the sample consisted of Western Australia residents who were also familiar with World Vision operations.
Survey Instrument
In this study, the researcher was interested in gathering and collecting first-hand information and data while using primary sources of data. This was due to the degree of precision that was required. According to Kahneman and Tversky (2000), when conducting a survey, the choice of primary data is important since it is where one extracts information needed for the study. Terms in the survey instrument were clearly defined in order to avoid misunderstanding.
The study adopted the use of mailed surveys; these were mailed directly to the respondents. The respondents were then required to fill the survey within a period of less than 10 minutes (Cresswell & Miller, 2000). Mailed surveys are always cheaper than interviews, even if the interviews are in persons or conducted through telephone. A mailed survey also takes less time to fill than interviewing. Mailed surveys were more efficient in the sense that it was possible to reach out to respondents that are remotely located.
Furthermore, mailed surveys were perceived to be appropriate since they provided confidential and sensitive information which could not be provided via hand-delivered questionnaires (Cresswell & Miller, 2000). In order to maximize the overall probability of response to the mailed surveys, attention was given to each point of the survey process where it was deemed that the responses might breakdown.
Some of the envisioned response breakdowns included: wrong mail addresses that could result to non-delivery, the sent mail could sometimes appear as junk mail or end in the spam folder and might be discarded without being opened, and lack of well-guided instructions for filling the questionnaire. However, efforts to overcome these response breakdowns were in place to enable high chances of mail returns with the appropriate responses required for this study.
Ethical Considerations
While analysing the managerial problem that led to this research, it was found out that WVA has witnessed a decline in funding from WA residents though statistics indicate a growth in the GDP of WA that has resulted to an increase purchasing power of the locals. To this end, their commitment towards supporting charity programs has declined with some of them making pledges that they do not even fulfil. Therefore, there is a growing need to campaign for charity and child support programs in WA.
This will in the end sensitize the WA residents on the importance of giving back to the society by supporting charity programs and child support programs like the WVA program. The sensitization will be in the sense that when WA residents commit to fulfilling their support pledges to WVA, they will enable WVA to have enough funding to contribute to the sustenance of the well-being of 20 million children by growing their income base to AUD $ 1 billion and also engage 1 million supporters by the year 2021.
Limitations to the Study
This study was faced by numerous constraints that could affect the data and information gathered, as well as the interpretation of the results. First, there may be a lot of secretiveness and fear of victimization among some of the respondents; this is owed to the biased perception and attitude the locals have towards WVA. To this end, some respondents might be willing to support the WVA program while others may not.
The unwilling residents may fail to fill in the survey instrument due to the negative attitude towards WVA programs. However, this research overcame secretiveness and fear of victimization by assuring the respondents that the information gathered was very confidential and that it was to be treated with the anonymity it deserves. The filled surveys also were confidential and only served the purpose of this study. Furthermore, some of the respondents were also unable to fill in all the sections of the survey instrument as they had very busy schedules. Some of the residents that fall under this category include senior managers and senior government officials.
This, therefore, might lead to time wastage due to data collection process; however, the survey instrument had been tailored to be filled within 10 minutes. Some of the respondents also may not answer the questions while working. There was also a possibility of financial constraints as the data collection process and the entire research seemed to be extensive. Therefore, more funds were required to support this study.
The sampling design may also have not considered all the individual elements within the respective clusters. The data collection instrument may, therefore, have not reached all the potential respondents for this study. However, the major constraints to this study, was the fact that some respondents were reluctant to give their views and opinions on the survey instrument. This, in turn, might lead to a low response rate, meaning that the study might not be a representation of the true picture of the perception and attitude among WA residents toward WVA.
Participant Profile
This study targeted residents of WA to whom sampling was done and the survey instrument administered. There were many demographic variables that were used to segment the target population. These included the age, level of education, gender, donation status, occupation, and weekly level of income, ethnicity and many others. But for purposes of tabulation, the researcher deemed it necessary to use gender to tabulate the participant’s profile since this variable would have only two subdivisions on the entire population as opposed to the other demographic variables that would result in lengthy tabulations of the studied population.
However, these demographics are also discussed herein. As per the charity perceptions survey, the data indicates that 124 respondents were studied as per the sampling procedure of the total targeted population of WA residents. Male respondents were 50 and their female counterparts were 74. This is summarised in the table below.
Table 1.1.6: Participant profile.
Response Rate
The response rate indicates the rate at which the survey instrument administered to the respondents was returned. A total of 123 of the research tools were mailed to the respondents in the WA region. All the mailed questionnaires were filled and returned as illustrated below.
Table 1.2: Response Rate.
Table 1.2 indicates that 100 percent response was reported from the questionnaires that had been mailed to the respondents. This is quite impressing as the data collected indicated the reality, which is the perception and attitudes of Western Australia residents towards WVA charity programs. This will also enable WVA know the actual cause of lack of commitment for fulfilling their support pledges towards WVA programs. It will enable WVA to take the appropriate course of action to rectify the situation.
Demographic Variables
With close reference to the charity perceptions survey, the target population was segmented into demographic segments. When the demographics of the target population are used as the basis for segmenting it, more emphasis is laid on the characteristics of the target population. Such characteristics include but not limited to the age, income, marital status, occupation, education, ethnicity and gender.
In this case and for the purposes of this study, WVA segmented the target population into demographic segments which were based on age, gender, occupation, income, ethnicity, level of education, donation status to WVA and other charity-based organizations, perceptions and attitudes towards WVA and other charity-based organizations, household structure, employment status, donations capacity and financial commitment.
This was meant to develop demographic profiles which would be crucial in establishing the influence of demographic profiles over charitable giving. The questionnaire, therefore, comprises questions which were based on the established demographic profiles. The filled questionnaires will be helpful in establishing the relation between demographic profiles of the sampled population and the contribution behaviour towards charity by the WA residents.
Objectives
This study is based on three objectives highlighted in the sub-sections below. In a synopsis, this paper will analyse the aforementioned managerial problem with respect to the outlined objectives. The data used to achieve the objectives included the nominal data, ordinal, interval and ratio data.
The nominal data is generated for the purpose of identification only through the use of coding system. Numerical data is obtained from qualitative responses to make it easier for qualitative analysis. No mathematical operations can be used to make any meaningful results. It is measured by the use of nominal scales. The ordinal data is generated through ranking or ordering some measurements into ascending or descending order.
This data is used to compare and contrast results. It is measured by use of ordinal scales. The interval data shows changes from one point to another. Once generated, the data can only be used within particular limits or intervals. This data has no zero origin and it is measured by use of interval scales. Finally, the ratio data is generated from measurement of physical objects. This data can easily be expressed in units or amounts. It has a zero origin and it is measured by use of ratio scales.
Objective 1
To determine the current level of contribution towards charitable organisations by the residents of Western Australia their attitudes towards helping others notwithstanding.
Description
The purpose for this objective was to find out and determine the respective contributions by WA residents towards charity activities. Also, in this objective more emphases were laid on the attitudes of the residents towards various charitable organizations including WVA. The WA residents’ attitudes were evaluated; there were a number of questions which were drafted in the survey instrument to address this objective.
Measurements
The questions related to this objective gathered nominal data, interval data and open-ended data. Therefore, the appropriate measurements for this data were nominal scales, interval scales and descriptive statistics which involved computations of measures of central tendency and measures of dispersion.
Findings
Table 1.3.1.3.1: On-going donations to Charity.
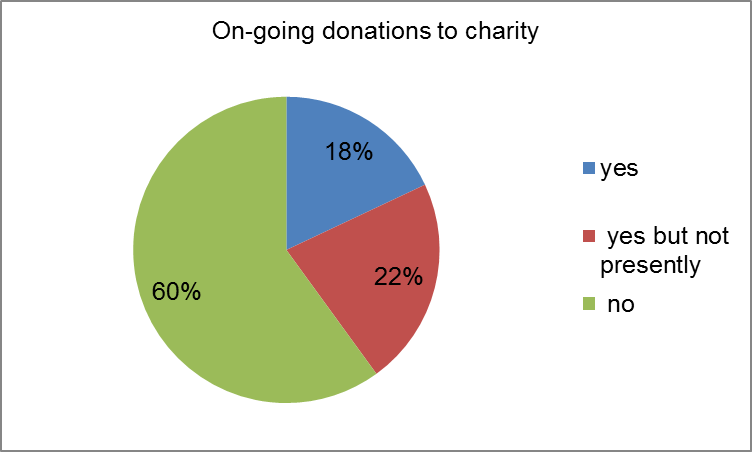
Table 1.3.1.3.2: Charities being supported.
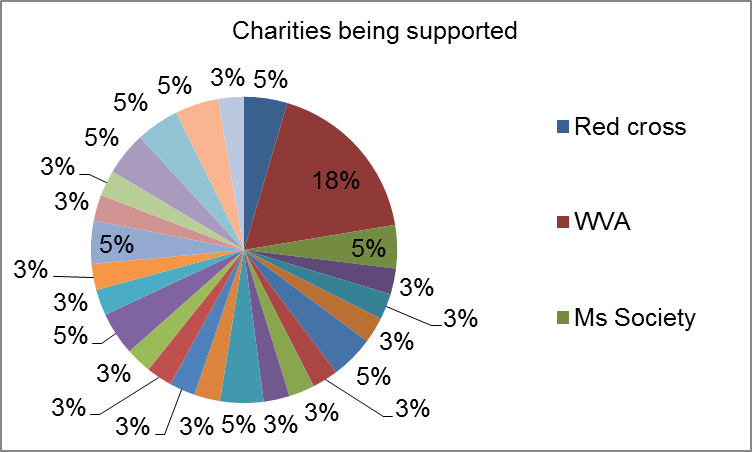
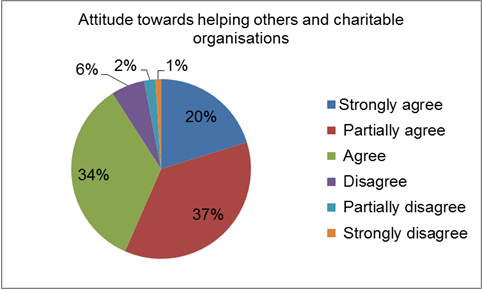
Table 1.3.1.3.3: Attitude towards helping others and charity.
Conclusion
From the findings above, it is evident that most WA residents are not supporting World Vision organization and other charitable organizations.
Objective 2
The second objective was to analyse the perception of WA residents towards World Vision.
Description
The purpose for this objective was to analyse the perception of WA residents towards World Vision brand in relations to other similar brands or organizations offering charity and support programs.
Measurements
The questions related to this objective gathered both interval and open-ended data. The appropriate measurements for this type of data were interval scales and computation of descriptive statistics
Findings
Table 1.3.2.3.1 Perception towards world vision brand.
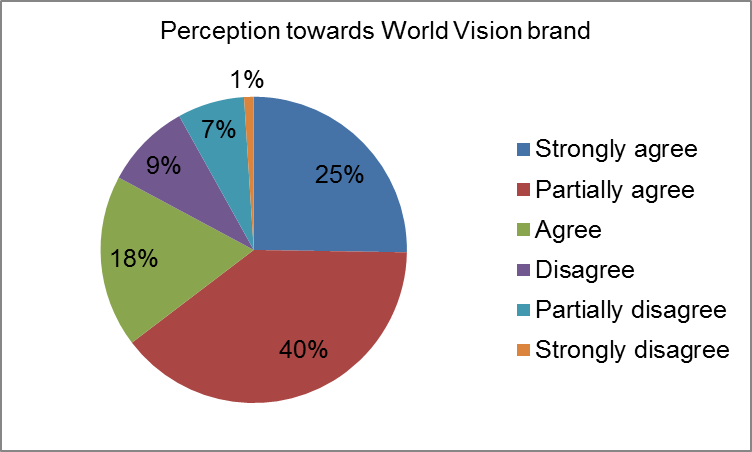
Table 1.3.2.3.2 Words describing World Vision Operations
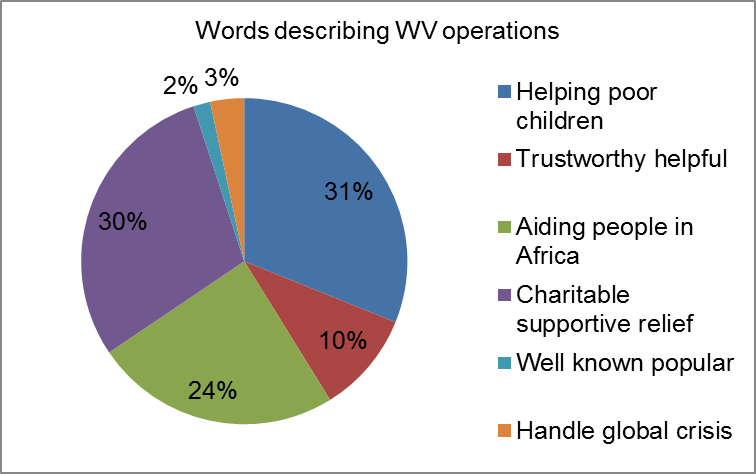
Table 1.3.2.3.3 World Vision Operations.
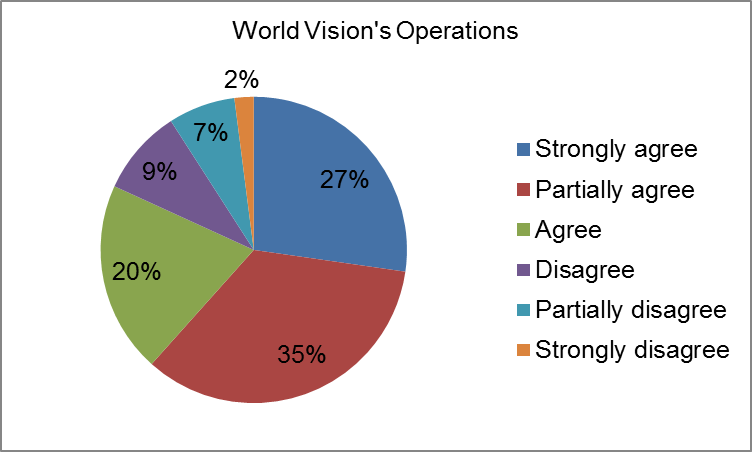
Conclusion
From these findings, it is evident that most WA residents (35% + 7%) do not know how World Vision operates though they have a moderate perception to World Visions’ brand.
Objective 3
The third objective was to analyse Western Australian resident’s current level of contribution towards World Vision Programs.
Description
The aim of this objective was to analyse the current level of contribution of WA residents toward World Vision brand. To understand this, the studied population was segmented in terms of demographics such as gender, income, occupation, ethnicity, age, and the employment status.
Measurements
The questions attached to this objective in the survey instrument gathered nominal data, ordinal data, ratio data, interval data and open-ended data. The measurements for this kind of data involved ordinal, nominal, interval and ratio scales. The data also was to be measured by the use of descriptive statistics.
Findings
Table 1.3.3.3.1 Current Donations to World Vision.
Table 1.3.3.3.2 Donations Capacity to World Vision.
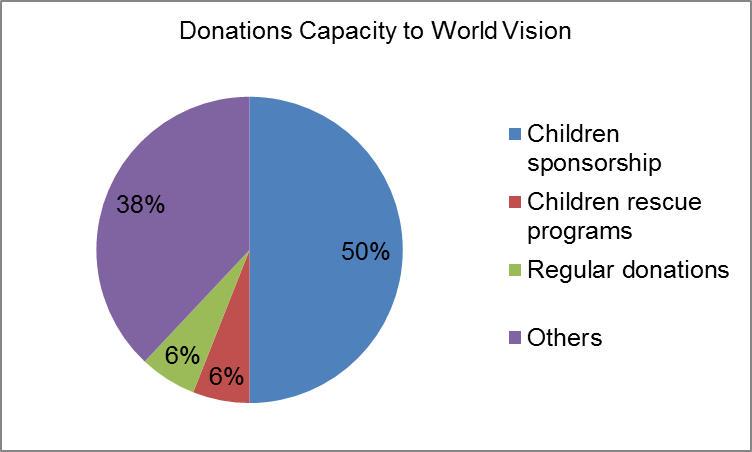
Table 1.3.3.3.3 Duration of donations to World Vision.
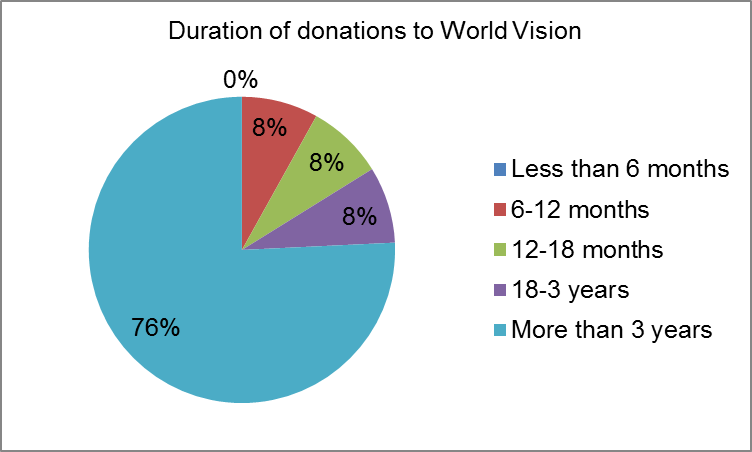
Table 1.3.3.3.4 Reason for supporting world vision.
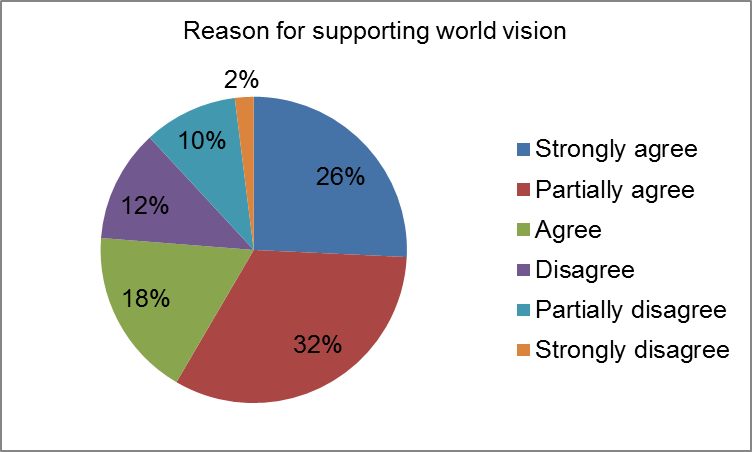
Table 1.3.3.3.5 World Vision’s Projection for Future Donations.
Table 1.3.3.3.6: Gender.
Table 1.3.3.3.7: Ethnicity.
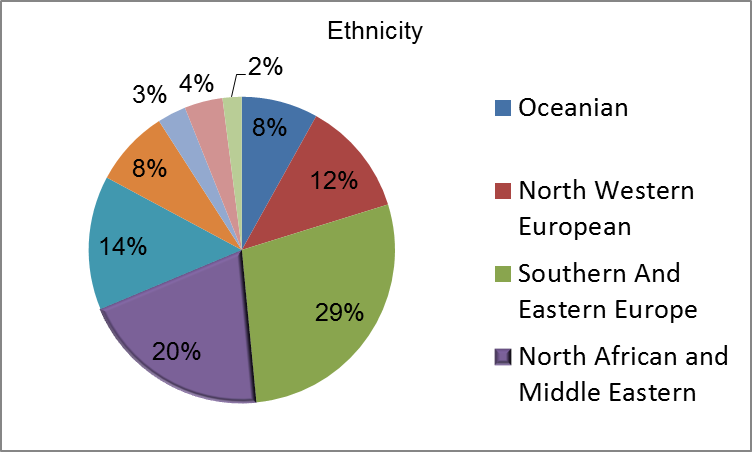
Table 1.3.3.3.3.8: Current Employment at FIFO.
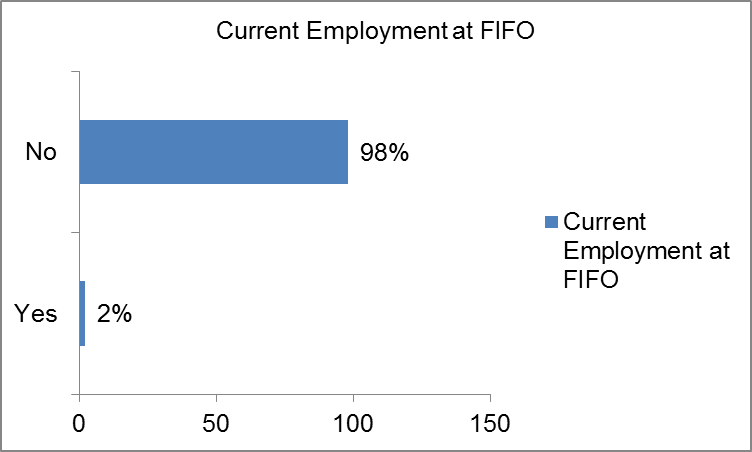
Table 1.3.3.3.3.9 Employment at FIFO.
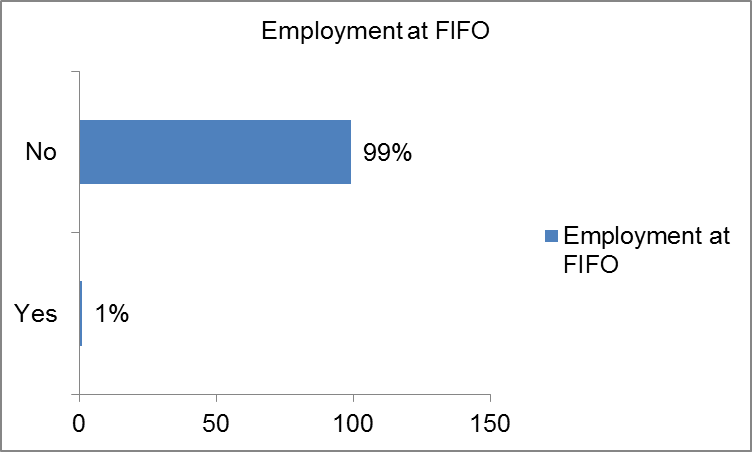
Table 1.3.3.3.10 Employment Status.
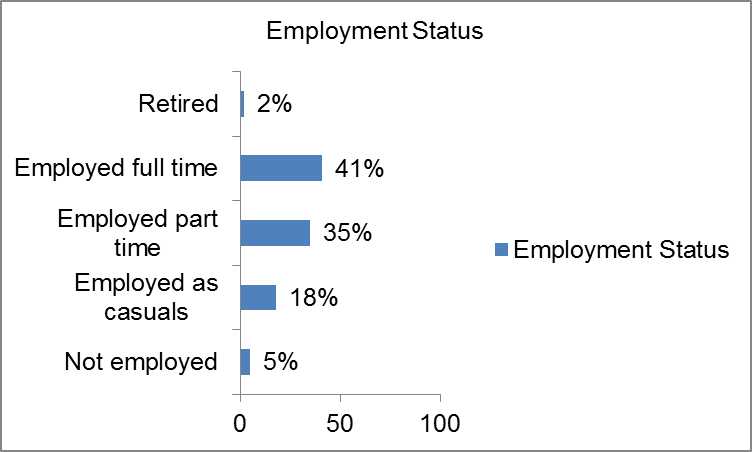
Table 1.3.3.3.11: Certainty about Employment.
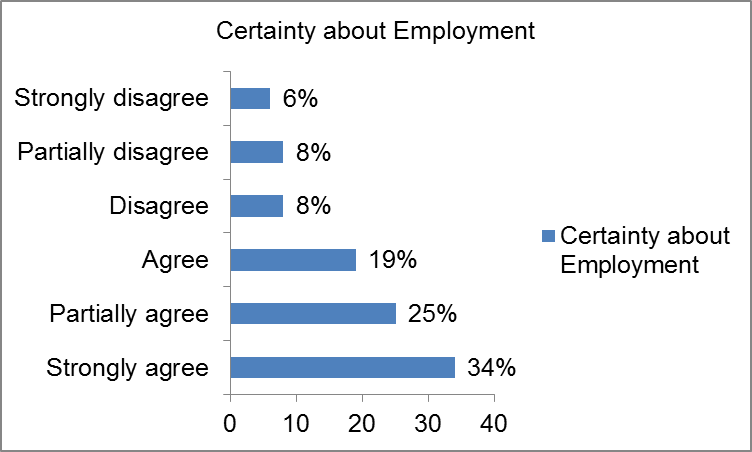
Table 1.3.3.3.12: Level of education.
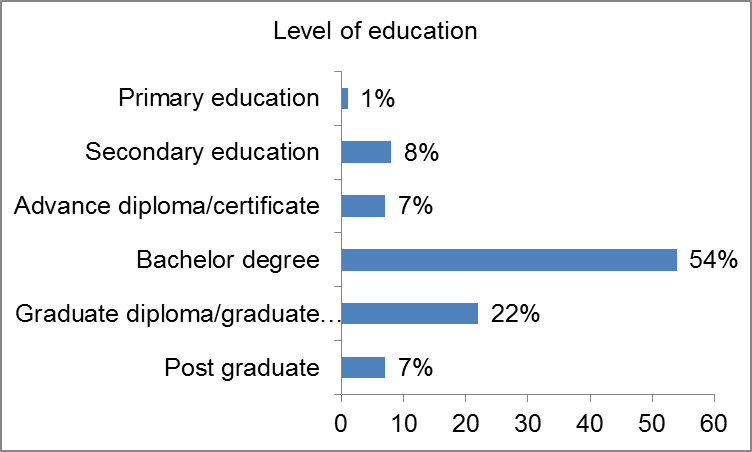
Table 1.3.3.3.13: Major Financial Commitment.
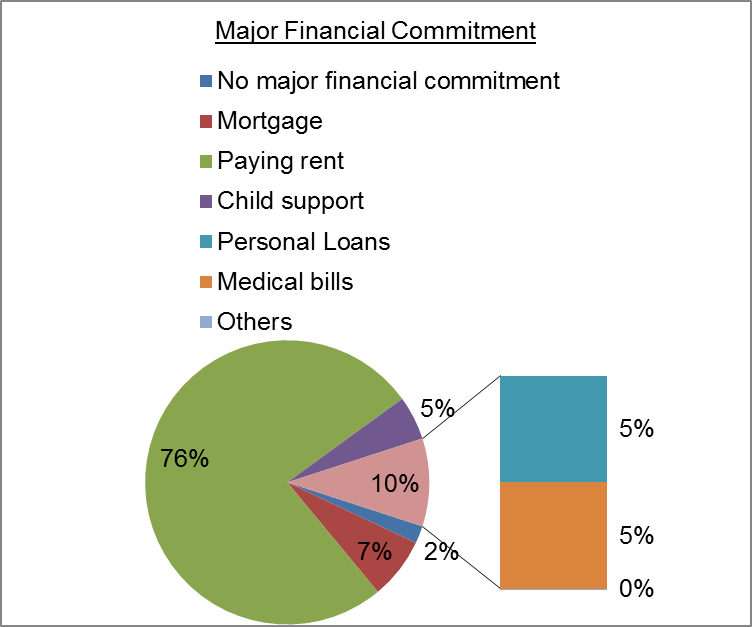
Fig 1.3.3.3.13: Major Financial Commitment
Conclusion
From these findings, it evident that currently most WA residents are not supporting World Vision and other charity-based organization though they wish to do so in future. WA residents have stable sources of income though they are holding back from supporting the World Vision brand and other charity organizations. This is due to the perception and attitude the residents have towards charity.
Conclusion and Recommendations
With regards to objective 1, the WA residents’ contributions toward WVA organization are minimal as compared to the contribution that is made to other charitable organizations. WA residents have stable sources of income, and are unwilling to sponsor charitable organizations currently, but willing to do so in the near future. As regards to objective 2, the perception towards WV is moderate. With respect to objective 3, the current contribution to World Vision program by WA residents is low. To this end, it is recommended that:
- The World Vision has to advertise and market its brand aggressively.
- The World Vision has to introduce sensitization programs to explain to the residents of WA the need for supporting charity.
- There is a growing need for WVA to consistently conduct market surveys on its brand with respect to the perception and attitudes of WA residents.
- World Vision has to consider rebranding as a strategy to save the situation.
- The world vision will have to evaluate the progress achieved by their charity based programs so that they can use the results as the basis for soliciting for funds to support their programs.
References
Creswell, J. W., & Miller, D. L. (2000). Determining validity in qualitative inquiry. Theory into Practice, 39 (3), 124-130.
Gummesson, E. (2000). Qualitative Methods in Management Research. Carlifonia, CA: Thousand Oaks, CA.
Kahneman, D., & Tversky, A. (2000). Choice, Values, Frames. Cambridge: Cambridge University Press.
Minkov, M. (2007). What makes us different and similar: A new interpretation of theWorld Values Surveyand other cross-cultural data. Sofia, Bulgaria: Klasikay Stil Publications.
Myers, M. D. (2013). Qualitative Research in Business & Management. London: Sage Publications.
Springer, M. D (2013). Qualitative Research in Business & Management. London: Idea Group Publishing.
Stanway, A. (2015). Business Research Practices. Hoboken: John Wiley & Sons.
Trauth, E. M. (2001). Qualitative Research in IS: Issues and Trends. London: Idea Group Publishing.
Warf, F., & Barney, S. (2007). The World Economy: Resources, Location, Trade and Development. Boston, MA: MC-Graw Hill/Irwin.
Wieland. A., & Handfield, R. (2013). The Socially Responsible Supply Chain: An Imperative for Global Corporations. Supply Chain Management Review, 17 (5), 12-40.