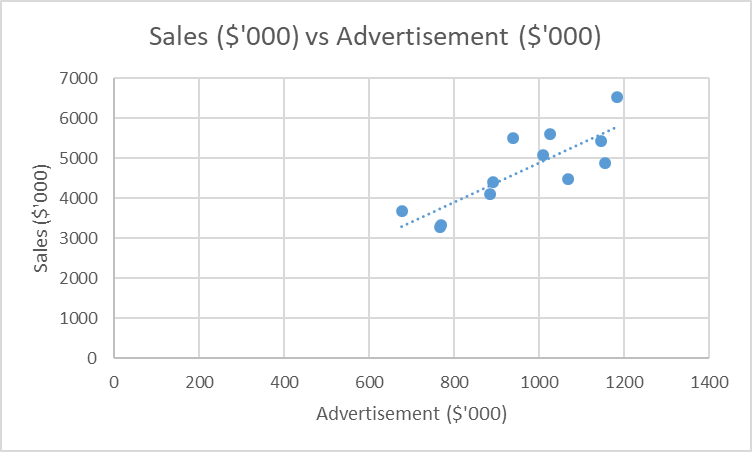
Figure 1 above shows an increasingly positive relationship between sales revenue and advertisement expenditure. This implies that the more the organization spends creating advertisement posts, the higher the sales revenue generated (Pauwels et al., 2019). Therefore, it is essential for the organization to consider this relationship when planning their daily activities because it has proven to be effective in promoting sales which may later lead to the growth of the organization. The scatter plot above portrays that outliers are not present, hence reducing their effect on the revenue generation. Furthermore, the absence of outliers in the data shows that it is suitable for use in prediction.

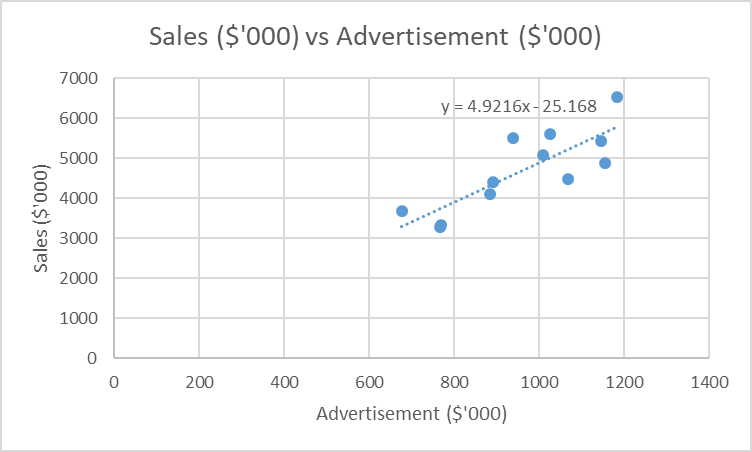
From figure 2 above, the fitted regression model is Sales = 4.9216, Advertisement – 25.168. The regression model has a slope of 4.9216, which implies that the sales of the organization can be obtained by multiplying the advertisement with the slope coefficient. The slope value is close to five when rounded off, hence a significant value in the estimation of the sales revenue (Bangdiwala, 2018). The value of the slope provides the marketing manager with the necessary clue regarding the outcome of investing in the advertisement.
The intercept from figure 2 above when the cost of advertisement is zero is -25.168. This value is significant as it implies that when the organization does not invest in the advertisement sector, the overall sales revenue will be negative, indicating a reduction in sales or loss (Bangdiwala, 2018). It is, therefore, necessary for the organization to invest in this sector for it to realize an increase in sales revenue. The intercept provides the vital information when analyzing the organization’s future sales.
Table 1: Regression output
From table 1 above, the R squared value is 0.6785, which implies that 67.85% of the variability in sales can be explained by the advertisement expenditures. The value of R-squared is large, portraying that the model is suitable for predicting the sales revenue of the organization. The variation between R-square and adjusted R-square is small, hence implying that the model useful (Bangdiwala, 2018). When the value of advertisement is $950,000, prediction using this model is Sales = 4.9216 (950,000) – 25.168 = $4,675,494.832. The model overestimates the overall sales because, in real life situation, there is a saturation point where despite the high amount spent on advertisement, the revenue generation does not increase, and therefore leading to losses because of overspending.
Thus, it is crucial for the organization to identify the maximum amount that should be used for advertisement, hence preventing losses through overspending. This can be attained through a regression model with large samples, thereby reducing the error resulting from having a model with few items. This will also be enhanced by checking the value of the adjusted R square value as it takes into consideration the size of the sample.
References
Bangdiwala, S. (2018). Regression: Simple linear.International Journal of Injury Control and Safety Promotion, 25(1), 113-115. Web.
Pauwels, V., Guyot, A., & Walker, J. (2019). Evaluating model results in scatter plots: A critique.Ecological Modelling, 411, 1-6. Web.