Abstract
Bathymetric measurements of the New York Bight were based on the ocean bottom topography and compared the ocean depth to the distance from the shore of Long Island. The results showed that the depth starts to increase dramatically after the -200 m contour line. The internal wave measurements of the New York Bight were based on calculating the distance between internal wave groups and time intervals for each pair. The results disconfirmed the idea that continental shelf internal waves are generated by tidal forces.
Introduction
Bathymetric data refer to the information on the depth of water in different parts of an ocean. Internal waves are waves generated by the motion of the ocean water with the tide, unlike surface waves generated by the wind. Measurements of depth and internal waves were performed for the New York Bight, which is the ocean region near the shore of New York City.
Methods
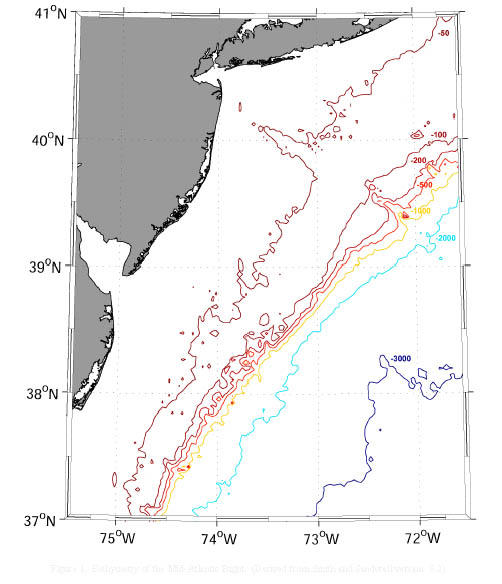
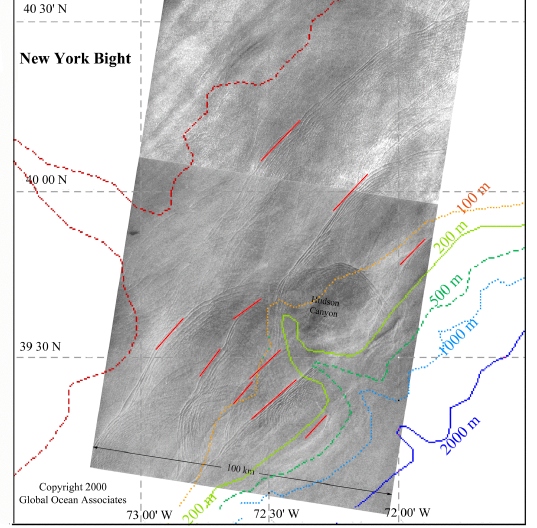
Bathymetric data were acquired from the New York Bight ocean bottom topography (see Figure 1). The analysis of data was based on measuring the distances between the shore of Long Island and the contour lines marking the depth change along the line that includes two points at 38 N Lat, 72 W Long and 40 N Lat, 73 W Long. Internal waves measurements were performed by detecting leading edges of internal wave groups, analyzing the distances between selected groups of internal waves, and calculating time intervals between them. The source used for these measurements is the ERS-1 C-Band VV SAR images of the New York Bight (see Figure 3).
Results and Conclusion
The variable contour interval that was used for the bathymetric analysis is shown in Figure 1.

On this image, the distances were measured from the shore of Long Island to each of the contour lines along the line that includes two points at 38 N Lat, 72 W Long, and 40 N Lat, 73 W Long. The results of the bathymetric measurements of the New York Bight are shown in Table 1.
Table 1. Distances from the Shore of Long Island to the contour lines signifying the depth change in the New York Bight.
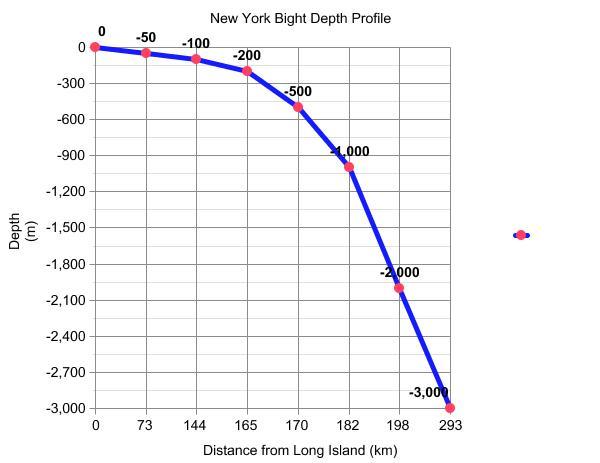
These data are represented graphically in Figure 2.

As seen on the graph, the depth starts to increase dramatically after the point of -200 m. This allowed oceanographers to call the -200 m contour line the “shelf break” of the New York Bight.
The internal wave measurements were based on the image shown in Figure 3.

The distances between the groups were measured. Based on this, the time intervals between them were calculated. The results are shown in Table 2.
Table 2. Distances between seven internal wave groups and time intervals for each distance between each pair.
These results allow concluding that continental shelf internal waves are not generated by tidal forces. While the periods of tidal forces are about 12.5 to 13 hours per cycle, measured time intervals are significantly shorter.