Summary
The C-chart is a reliable monitoring tool that considers changes in an indicator over a given period. This control tool allows the company to identify inconsistencies and defects in the study group (Goel, 2020). C-charts have lines for the upper and lower control limits. The control tool allows the organization to measure the stability of a process and track the results of improvement or deterioration (Goel, 2020). For example, C-charts will monitor product quality, calculate the number of defects, or measure the level of customer satisfaction in numerical terms. C-charts are a tool to control the number of product returns or negative customer reviews.
Example
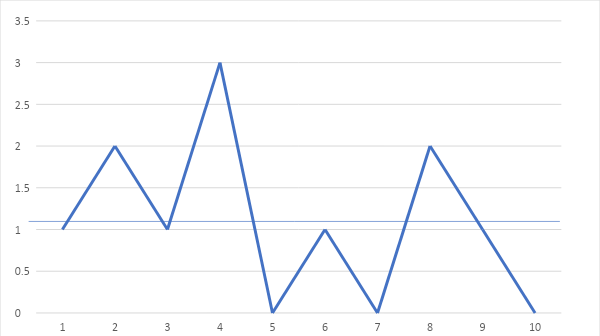
An Italian restaurant uses a C-chart to monitor customer satisfaction. Every week, the number of dissatisfied customers is summarized and recorded in a table. Based on this data, a chart where 1.1 will be the average number of complaints per week can be created. According to the formula for constructing C-charts, the upper limit will be 4.25, and the lower limit will be negative 2.05, equating to zero. As from the diagram, the number of complaints does not approach the upper limit and remains at the lower one several times. It can be said that Italian cuisine restaurant competently uses a visual control tool. The situation with customer complaints is under control. Firstly, their performance does not approach the maximum allowable values in a given context. Secondly, the indicators are the minimum in 3 of the 10 indicated weeks.
Table 1.
CL = 11/10 = 1.1 (The average number)
UCLc = 4.25
LCLc = – 2.05 = 0

Reference
Goel, A. (2020). Metrology & Quality Control. Technical Publications.