Comparing Florida With California and Illinois Research Paper

Exclusively available on Available only on IvyPanda®
This academic paper example has been carefully picked, checked and refined by our editorial team.
You are free to use it for the following purposes:
  • To find inspiration for your paper and overcome writer’s block
  • As a source of information (ensure proper referencing)
  • As a template for you assignment

Background

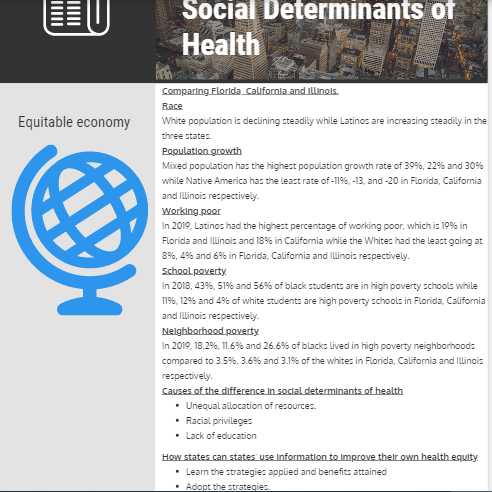
The social inequalities existing in the three states result from decades of systemic racism and historically biased resource allocation. The way a government distributes its resources can result in the inequalities experienced (Donkin et al., 2018). Some of the indicators of inequality are race, population growth, working poor, school poverty, and neighborhood poverty. Based on the information from National Equity Atlas, states such as Florida, California, and Illinois have different data regarding the indicators. For example, the racial makeup in Florida, California, and Illinois has some similarities and differences (National Equity Atlas, 2021). All three states have Asians, Blacks, Whites, Mixed, Native Americans, and Latinos. In all the states, the population of Whites continues to decline while Latinos continue to rise steadily. The following table shows the similarities and differences of data involving the five indicators in the three states.

IndicatorsFloridaCaliforniaIllinois
Race/EthnicityThe white population is declining steadily while Latinos are increasing steadily from 1980 to 2020.Whites are declining while Latinos are increasing from 1980 to 2020.Whites are declining while Latinos are increasing from 1980 to 2020.
Population growthFrom 2010 to 2019, the mixed population has the highest population growth rate of 39%, while Native America has the least rate of -11% (National Equity Atlas, 2021).From 2010 to 2019, the mixed population has the highest growth rate of 22%, while Native America has the lowest rate of -13%.From 2010 to 2019, the mixed population has the highest growth rate of 30%, while Native America has the lowest rate of -20%.
Working poorIn 2019, Latinos had the highest percentage of working poor at 19%, while the Whites had the Lowest going at 8%.In 2019, Latinos had the highest percentage of working poor at 18%, while the Whites had the lowest at 4% (National Equity Atlas, 2021).In 2019, Latinos had the highest percentage of working poor at 19%, while Whites and Asians had the lowest percentage at 6% each (National Equity Atlas, 2021).
School povertyIn 2018, 43% of black students were in high poverty schools, while 11% of white students were in high poverty schools.In 2018, 51% of black students were in high poverty schools, while 12% of white students were in high poverty schools.In 2018, 56% of black students were in high poverty schools, while 4% of white students were in high poverty schools.
Neighborhood povertyIn 2019, 18.2% of blacks lived in high-poverty neighborhoods compared to 3.5% whites.In 2019, 11.6% of blacks lived in high-poverty neighborhoods compared to 3.6% of whites (National Equity Atlas, 2021).In 2019, 26.6% of blacks lived in high-poverty neighborhoods compared to 3.1% whites.

Insight and Analysis of Each Indicator

The indicators being investigated are race, population growth, working poor, school poverty, and neighborhood poverty. First, starting with race, the population of Latinos has grown tremendously, from 9% in 1980 to 26% in 2020, while the population of whites has declined steadily, from 77% in 1980 to 53% in 2020 in Florida (National Equity Atlas, 2021). Second, the mixed population had a 39% growth rate of 39% while Native America had a growth rate of -11% between 2010 to 2019 in Florida. Third, Latinos had the highest percentage of working poor while the whites had the lowest percentage in all the three states (National Equity Atlas, 2021). Fourth, most black students are in high-poverty schools compared to white students in the three states. Finally, the blacks were the majority of people living in high neighborhood poverty.

The Indicators as Drivers of Inequity

Race, population growth, working poor, school poverty, and neighborhood poverty can drive inequality in the US. First, race as an indicator results in population differences (National Equity Atlas, 2021). Based on the data source, it is projected that the population of minority groups will be more than the whites by 2050. Second, the population growth rate is linked to economic inequality. For example, millennials choose to have fewer children because of economic hardships. Third, working poor are often associated with unequal pay in the workplace and illiteracy. When there is unequal pay, some people will work and still earn less compared to others (Lohmann & Marx, 2018). Fourth, school poverty can be linked with unequal distribution of resources in public schools. Finally, neighborhood poverty can also be linked with an unequal allocation of state resources. For example, the neighborhoods where blacks live have been deprived of resources. Therefore, these indicators can be used as drivers of inequality in the US.

Strategies to Help Grow an Equitable Economy

There are various strategies that can be applied to help foster an equitable economy by addressing inequality. First, racial inclusion in governance will aid in eliminating poverty in all races in the US. The strategy will ensure that the interest of everyone is included regardless of their race. Second, increasing the minimum wage is a strategy aimed at reducing the number of working poor among Latinos and other minority groups in the US. Third, raising the standards of all public schools and providing social support services will ensure that they have appropriate resources to support learning (Manatt, Phelps & Phillips, LLP, 2019). Finally, the implementation of equitable economic development will aid improve the status of poverty-stricken areas. For instance, change the black people’s neighborhoods in the three states. Thus, these strategies can be implemented to create an equitable economy.

Infographic
Infographic

References

Donkin, A., Goldblatt, P., Allen, J., Nathanson, V., & Marmot, M. (2018). . BMJ global health, 3(Suppl 1), e000603.

Lohmann, H., & Marx, I. (Eds.). (2018). Handbook on in-work poverty. Edward Elgar Publishing.

Manatt, Phelps & Phillips, LLP. (2019). . Health Policy in Brief.

(2021). National Equity Atlas.

More related papers Related Essay Examples
Cite This paper
You're welcome to use this sample in your assignment. Be sure to cite it correctly

Reference

IvyPanda. (2023, February 21). Comparing Florida With California and Illinois. https://ivypanda.com/essays/comparing-florida-with-california-and-illinois/

Work Cited

"Comparing Florida With California and Illinois." IvyPanda, 21 Feb. 2023, ivypanda.com/essays/comparing-florida-with-california-and-illinois/.

References

IvyPanda. (2023) 'Comparing Florida With California and Illinois'. 21 February.

References

IvyPanda. 2023. "Comparing Florida With California and Illinois." February 21, 2023. https://ivypanda.com/essays/comparing-florida-with-california-and-illinois/.

1. IvyPanda. "Comparing Florida With California and Illinois." February 21, 2023. https://ivypanda.com/essays/comparing-florida-with-california-and-illinois/.


Bibliography


IvyPanda. "Comparing Florida With California and Illinois." February 21, 2023. https://ivypanda.com/essays/comparing-florida-with-california-and-illinois/.

If, for any reason, you believe that this content should not be published on our website, please request its removal.
Updated:
Privacy Settings

IvyPanda uses cookies and similar technologies to enhance your experience, enabling functionalities such as:

  • Basic site functions
  • Ensuring secure, safe transactions
  • Secure account login
  • Remembering account, browser, and regional preferences
  • Remembering privacy and security settings
  • Analyzing site traffic and usage
  • Personalized search, content, and recommendations
  • Displaying relevant, targeted ads on and off IvyPanda

Please refer to IvyPanda's Cookies Policy and Privacy Policy for detailed information.

Required Cookies & Technologies
Always active

Certain technologies we use are essential for critical functions such as security and site integrity, account authentication, security and privacy preferences, internal site usage and maintenance data, and ensuring the site operates correctly for browsing and transactions.

Site Customization

Cookies and similar technologies are used to enhance your experience by:

  • Remembering general and regional preferences
  • Personalizing content, search, recommendations, and offers

Some functions, such as personalized recommendations, account preferences, or localization, may not work correctly without these technologies. For more details, please refer to IvyPanda's Cookies Policy.

Personalized Advertising

To enable personalized advertising (such as interest-based ads), we may share your data with our marketing and advertising partners using cookies and other technologies. These partners may have their own information collected about you. Turning off the personalized advertising setting won't stop you from seeing IvyPanda ads, but it may make the ads you see less relevant or more repetitive.

Personalized advertising may be considered a "sale" or "sharing" of the information under California and other state privacy laws, and you may have the right to opt out. Turning off personalized advertising allows you to exercise your right to opt out. Learn more in IvyPanda's Cookies Policy and Privacy Policy.

1 / 1