Introduction
Theoretical Background
Most biochemical processes are enzymatic, which means that they are carried out under the action of biologically active enzyme molecules. By their nature, enzymes should be classified as proteins, which have a catalytic function and can initiate and accelerate the course of a biochemical reaction (NIH, 2023). This acceleration is based on the attachment of the substrate to the enzyme’s active center, and this attachment is specific, which means that each reaction requires a particular kind of enzyme.
Amylase is a type of enzyme synthesized by the pancreatic and salivary glands. Amylase can break the α-1,4-glycoside bond within starch, resulting in the formation of oligosaccharides, including glucose. In more detail, amylase, which is synthesized in the oral cavity, helps to break down incoming food starch into maltose and maltotriose molecules, simpler structured substances (Far et al., 2020).
On entering the stomach via the digestive tract, the food is not attacked by amylase because the excessively acidic environment of the stomach inhibits the specific cleavage reaction (Santos, Correia, and Vilela, 2023). Subsequently, however, as pieces of food pass into the intestine, amylase is released from the pancreatic ducts, which breaks down the remaining starch and oligosaccharides to glucose, which is then absorbed into the blood. Thus, amylase is the body’s digestive enzyme for transforming complex chains of carbohydrates into simpler monomeric units.
In addition to the fact that each enzymatic reaction is specific, many factors influence their course. These include temperature, additional components in the medium that can initiate side reactions, and pH. The pH should be understood as the medium’s acidity or, in mathematical terms, the negative decimal logarithm of the concentration of hydrogen ions in solution (EPA, 2022).
Strictly speaking, the more H+ ions in a solution, the lower its pH. The pH can change the enzyme’s activity and modify the active center, intensifying or inhibiting the enzymatic reaction. For the effective and most productive enzymatic action of amylase on starch, creating an optimal pH at which the enzyme activity is maximal is critical.
Objective
The present laboratory work aims to investigate the effect of pH on the rate of enzymatic cleavage of starch by amylase. The experiment hypothesized that the optimal pH for amylase activity would be at the intermediate values of the scale, outside the field of highly acidic or fundamental values. The rationale for this hypothesis is the assumption that oral and intestinal amylase activity is not affected by extreme pH values.
Materials and Methods
Materials Used
During this laboratory work, the following materials and instruments were used:
- Consumables:
- Iodine solution.
- Amylase solution.
- Starch solution.
- pH solutions.
- Equipment:
- Pipette.
- Water bath.
- Test tube rack.
- Syringe.
- pH meter.
- Stopwatch.
- Thermometer.
- Mixer.
- Dimple tile.
Method
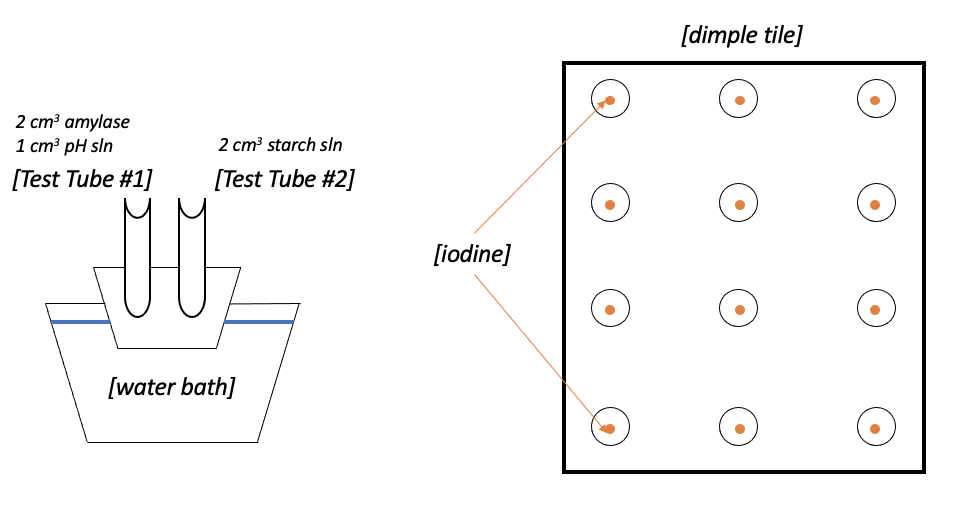
This laboratory work was based on an experiment that manipulated pH to determine starch staining trends as the dependent variable. One drop of iodine was added to each dimple tile using a pipette, then 2 cm3 of amylase solution was transferred to the test tube using a syringe, and the syringe was disposed of after use. A second syringe with 1 cm3 of pH solution was added to the test tube, and the syringe was disposed of. A third syringe was used to transfer 2 cm3 of the starch solution into the second test tube, and the syringe was disposed of after use.
The first test tube (2 cm3 amylase solution and 1 cm3 pH solution) and the second test tube (2 cm3 starch solution) were heated in a water bath at 30°C (Figure 1). After heating, the starch solution from the second test tube was carefully poured into the first test tube, and vigorous mixing was started using a mixer. A stopwatch was started at the start of mixing: after 20 seconds, a part of the mixture was transferred using a pipette to the first dimple tile, where iodine had been added earlier.
After another 10 seconds (30 seconds total), the second part of the mixture was transferred to the second well. Every ten seconds, the solution was transferred to the corresponding wells. All previous steps were repeated 13 more times for different integer pH values (1 to 14).

During the experiment, data were collected on the pH values of the solution added to the first test tube and the average time it took for the mixture to change color when added to the iodine in the well. In addition, the total number of wells that changed color was measured. The data were entered into an overall table and then used to analyze and construct visual representations.
The laboratory experiment involved several precautions to preserve the students’ and laboratory equipment’s health and safety. First, the room had to be well-ventilated to avoid the accumulation of harmful and toxic gases, including iodine evaporation, which could adversely affect health. Second, when using a water bath, it was important not to create excess water, which, when boiling, could get on the skin and cause burns, and not to touch the heating elements directly.
Third, all used syringes had to be disposed of properly: using the same syringe more than once was forbidden, as they could be contaminated and negatively affect the quality of the results. Fourth, care had to be taken when using the test tubes, as splitting or breaking them could cause damage to the skin and eyes. It was essential to check the test tubes for chips and cracks and to dispose of them in the case of unserviceability. Fifth, the iodine solution is quite toxic so that skin contact could irritate. Protective laboratory clothing and goggles should have been used, and iodine should have been carefully poured from the container into the wells.
Results
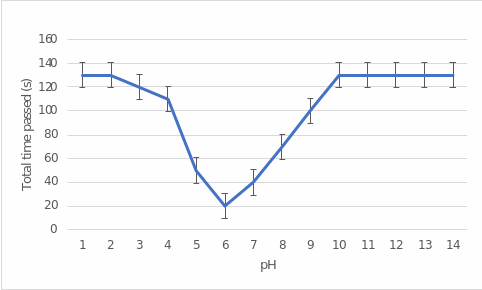
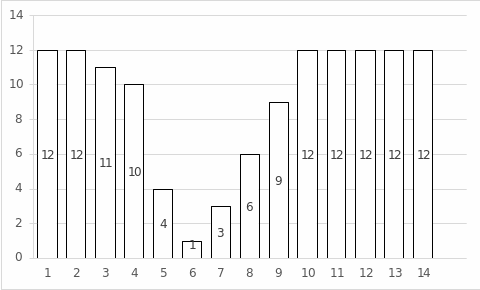
Table 1 shows the results of the elapsed time to stain and the total number of wells stained as a function of the pH of the solution added. The elapsed time data were plotted in Figure 2, showing the dependence of this time on pH. Figure 3 shows the dependence of the number of stained wells on pH. As follows from both representations, the forms of dependence are almost identical: there is a vast “pit” in the pH range from 4 to 10.
Table 1 — Results of direct measurements of the number of stained wells and elapsed time depending on the pH value of the medium.


Discussion
This work aimed to investigate the effect of pH on the enzymatic activity of amylase in the reaction of starch cleavage into oligosaccharides and glucose. For this purpose, an experiment was carried out in which different pH solutions of starch were created, and iodine was used to indicate enzymatic activity. In more detail, when iodine was added to the starch solution, intense binding was observed, resulting in a change in the coloration of the solution to dark blue or purple due to the formation of the Clathrate compound (Jaiswal et al., 2019).
It was essential to understand that the more active the enzyme is, the faster the starch decomposes into glucose. Synthesizing these reasonings, the shorter time to stop color change by the starch solution when added to iodine corresponded to the greatest intensity of the amylase enzyme. The shorter the time it would take to stain, the more active the enzyme was observed at a given pH. A similar reasoning was valid for the number of wells stained.
The results of this experiment showed a wide pit in the range of 4 to 10 pH, which corresponds to the least time to stain the starch. A closer look shows that the lowest time was characteristic of a pH of 6, the same test with the least stained wells. In other words, this showed that the optimal pH for amylase fermentation activity was 6. Interestingly, the empirical pH value was lower than the reference value of 8.5 (Ramian, Arabi, and Hemmati, 2018). The difference between the data could have been due to experimental errors and errors in variation. Notably, with strongly acidic media, for which pH was 1 to 2, and strongly basic media, which ranged from 10 to 14, amylase performed almost no enzymatic activity because all wells were stained. It took the longest time to stop staining.
Errors
Although this laboratory work satisfied the objective, confirmed the hypothesis, and determined the optimal pH, it does not exclude some errors. First, it is not ruled out that the pH values of the added solutions were kept constant and were integer. Second, it does not rule out the presence of systematic stopwatch errors, which may have negatively affected the quality of the results. Third, only one repetition was performed for each test, which could have led to distorted results and errors. Correcting these errors could be part of a future expansion of the laboratory experiment.
Conclusion
The present laboratory work aimed to empirically determine the optimal pH for the enzymatic activity of amylase in the starch cleavage reaction. The results showed that pH was equal to 6 because, at this level of acidity, it took the least time for starch to stain with iodine since most of the starch was cleaved. At the same time, the lowest number of stained wells was observed at pH 6. In other words, the work shows that the optimal pH for biochemical amylase activity was 6.
Reference List
EPA. (2022). What is pH? Web.
Far, B.E., et al. (2020) ‘Microbial alpha-amylase production: progress, challenges and perspectives,’ Advanced Pharmaceutical Bulletin, 10(3), pp. 350-361.
Jaiswal, R.K., et al. (2019) ‘Amylase based enzymatic time temperature indicator (TTI) as thermal abuse marker for frozen chicken meat,’ Indian Journal, 54(1), pp. 59-62.
NIH. (2023). Enzyme. Web.
Ramian, P., Arabi, M. and Hemmati, R. (2018) ‘Novel amylase in coelomic fluid and body extract from the earthworm Allolobophora chlorotica,’ Biomacromolecular Journal, 4(1), pp. 35-45.
Santos, M.J., Correia, E. and Vilela, A. (2023) ‘Exploring the impact of α-amylase enzyme activity and pH on flavor perception of alcoholic drinks,’ Foods, 12(5), pp. 1018-1039.