Introduction
Vegetation structure is an important attribute of an ecosystem because it provides primary data about a given ecosystem. Essentially, vegetation structure is a vertical and horizontal arrangement of vegetation in a space to form a three dimensional structure (Lawley et al. 2015). Vegetation structure comprises species richness, density, canopy strata, canopy cover, diversity, size, distribution, and debris materials.
Assessment of vegetation structure is very important in ecological studies because it offers information about the potential of a habitat to sustain plants and animals. Moreover, assessment of vegetation structure offers a way of determining carbon sequestration capacity and water cycling process. Ribeiro et al. (2013) state that the biomass of vegetation indicate the ability of an ecosystem to sequester carbon and regulate global warming.
The structural variables of the vegetation in terms of canopy cover, canopy strata, density, and distribution also influence water cycling in a given ecosystem.
Since vegetation structural variables relate, they are valuable in creating relationships and predicting other variables without necessarily determining them empirically, hence, saving time and resources. Therefore, the report describes an assessment of vegetation structure with a view of establishing the relationships of diverse variables using regression analysis.
Aim
- To assess vegetation structure of vegetation patches that are in the Gardners Creek Reserve and determine the relationships of the assessed structural variables using regression analysis.
Methods
Research Design
The study used quantitative research design in assessing vegetation structure. The study determined the density of trees by assessing the number of trees, large trees, and shrubs, and assessed percentages of bare ground, plant litter, and live plants.
It also determined the number of fallen branches and logs in the selected vegetation patches. Using the data collected, the study calculated total basal area, percent live basal area, total biomass, and total carbon storage.
Sample Design
The study area is the Gardners Creek Reserve, which is located at the Burwood Campus. The study selected the area because it has heterogeneous vegetation, which exist as vegetation patches of slope, plain, and riparian habitats.
In this view, the study selected vegetation patches for they are heterogeneous and representative of the vegetation structure of the reserve. The study employed convenience method of sampling in selecting vegetation patches that effectively represent the target population in the reserve.
Field Method
- Three patches of vegetation, slope, plain, and riparian was selected.
- A plot measuring 20 m by 20 m was measured using tapes and compasses, and then marked with poles.
- The marked plots was then labeled as plot 1, 2, and 3 and associated with group names.
- All trees with a diameter greater than 5 cm at 1.3 m above the ground were measured.
- The basal diameter of all shrubs was measured at 10 cm above the ground.
- The percentages of bare ground, live plants, plant litter, and rocks were determined and estimated to the nearest 10%.
- The number of fallen branches was counted in a diameter greater than 2.5 cm and less than 10 cm.
- The number of logs with a diameter of greater than 10 cm was counted.
Data Analysis
- The vegetation structure data were collated by indicating number of trees, number of large trees, (dbh > 30 cm), number of shrubs, percentage cover of bare ground, live plants, plant litter, and rocks, number of fallen branches, and number of logs in each of the plot number assessed.
- Basal area of each plot was calculated using the formula, which requires the diameter of each tree and an area of 400 m2.
- Base area = π x (diameter/2)2
- Total basal area (m2 ha-1) = total base area (cm2)*1/400
- Size distribution of trees was determined by classifying the according to six categories of diameters, namely, 5-10 cm, 11-20 cm, 21-30 cm, 31-40 cm, 40-50 cm, and greater than 50 cm.
- Percentage of live basal area was determined by calculating the total basal area for live shrubs and trees and total basal area of all shrubs and trees.
- Percentage of live basal area = (total basal area of live shrubs and trees)/(total basal area of all shrubs and trees).
- Biomass of each plot was calculated using allometrics developed by CSIRO.
- Total biomass (kg) = EXP [a + b * LN (diameter in cm)]
Where the variables are:-
- EXP is e*
- a is constant for eucalyptus tree, Acacia tree, and shrub, which can take -1.71, -1.59, and -2.68 respectively.
- b is the coefficient for large tree, tree, and shrub, which can take 2.21, 2.19, and 2.16 respectively.
- LN is the natural log
Total carbon storage (t ha-1) = total carbon (kg)*1/400*104*10-3
- Regression analysis was done to establish the nature of relationships that exist between density of plants (large trees, trees, and shrubs) and each of the vegetation structural variables, namely, bare ground cover, plant litter cover, live plant cover, number of fallen branches, number of logs, percent live basal area, total basal area, total biomass, and total carbon storage.
- Regression analysis was done to determine the relationship that exists between total basal area and total carbon storage.
Results
Table 1 below shows R2 values showing the nature of relationships that exist between the density of plants (number of large trees, number of trees, and number of shrubs) and vegetation structural variables, namely, % bare ground, % plant litter, % live plant, number of fallen branches, number of logs, total basal area, % live basal area, total biomass, and total carbon storage.
Table 1: R values.
From table 1, it is evident that number of large trees have no significant predictive relationship with bare ground (R2 = 0.0056), plant litter cover (R2 = 0.1623), live plant cover (R2 = 0.1372), number of fallen branches (R2 = 0.1422, number of logs (R2 = 0.0532), total basal area (R2 = 0.3587), and % live basal area (0.0772).
Moreover, from table 1, it is evident that the number of trees has no significant predictive relationship with bare ground (R2 = 0.0483), number of logs (R2 = 0.2889), total basal area (R2 = 0.1109), % live basal area (R2 = 0.3978), total biomass (R2 = 0.1823), and total carbon storage (R2 = 0.1824).
In the same manner, the number of shrubs has no significant predictive relationship with bare ground (R2 = 0.0310), plant litter cover (R2 = 0.2507), live plant cover (R2 = 0.3000), number of logs (R2 = 0.2057), total basal area (R2 = 0.0366), % live basal area (0.0043), total biomass (R2 = 0.0034), and total carbon storage (R2 = 0.0034).
Number of Large Trees as a Predictor
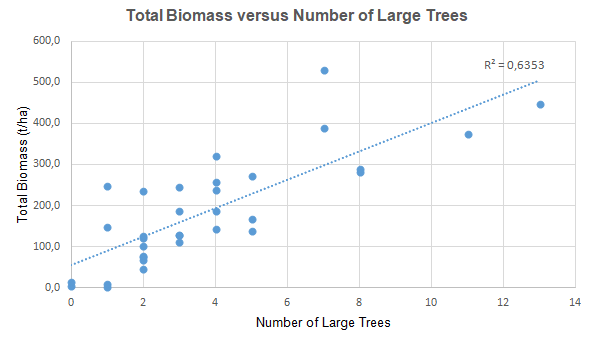
The number of large trees has a significant predictive relationship with total biomass and total carbon storage. There is a moderate positive relationship between the number of large trees in a patch and the total biomass of the large trees (R2 = 0.6353). Figure 1 below shows the moderate positive relationship, where the number of large trees predicts the total biomass of large trees.
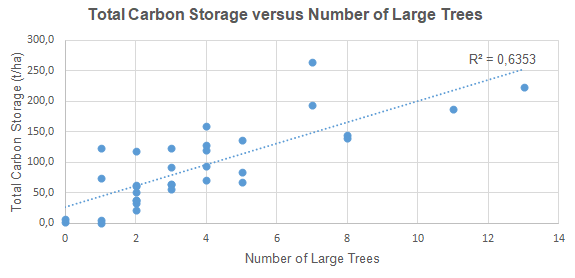
There is also a moderate positive relationship between the number of large trees and total carbon storage (R2 = 0.6353). Figure 2 below depicts that the number of large trees predicts the total carbon storage.
The Number of Trees as Predictor
The number of trees predicts many vegetation structural variables. The analysis of data using regression analysis shows that the number of trees significantly predicts the percentage of plant litter cover, percentage of live plant cover, and the number of fallen branches.
Figure 3 indicates that the number of trees has a significant predictive relationship with the percentage of plant litter cover. Evidently, there is a moderate positive relationship between the number of trees and the percentage of plant litter cover (R2 = 0.6298). The relationship implies that the number of trees predicts the percentage of plant litter cover.
Figure 4 shows that there is a significant predictive relationship between the number of trees and percentage of live plant cover. Specifically, there is a moderate negative relationship between the number of trees in a patch and the percentage of live plant cover (R2 = 0.5365). In this view, the number of trees negatively predicts the percentage of live plant cover.
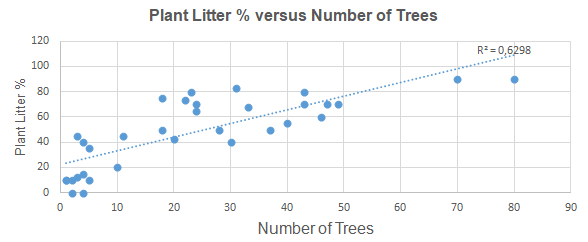
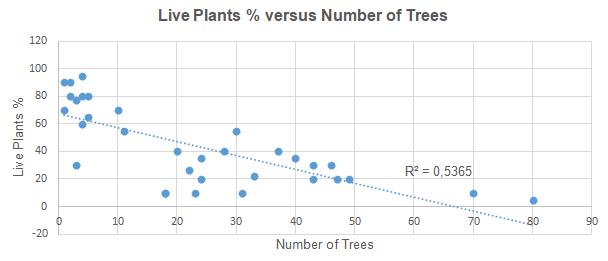
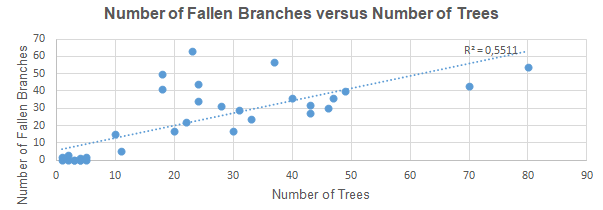
Figure 5 shows that there is a predictive relationship between the number of trees and the number of fallen branches. Essentially, there is a moderate positive relationship between the number of trees in patch and the number of fallen branches within the patch (R2 = 0.5365). The relationship means that the number of trees positively predicts the number of fallen branches.
The Number of Shrubs as a Predictor
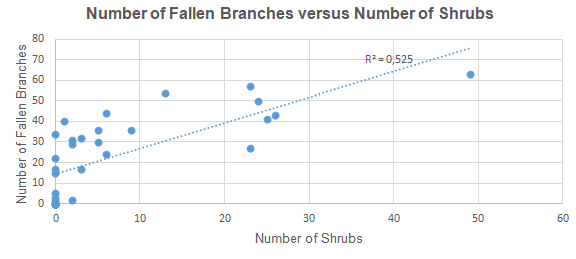
Shrubs have a predictive relationship with the fallen branches. Evidently, there is a moderate positive relationship between the number of shrubs and the number of fallen branches in a vegetation patch (R2 = 0.5511). The relationship implies that the number of shrubs positively predicts the number of fallen branches.
Discussion
The assessment of vegetation structure indicates that structural variables vary from one patch of vegetation to another. Vesk and Nally (2006) state that topography influences vegetation structure in a habitat. In this case, the structural variables vary since the study selected slope, plain, and riparian habitats.
Regression analysis shows that there is a moderate positive relationship between the number of large trees with total biomass (R2 = 0.6353) and total carbon storage (R2 = 0.6353). These findings imply that the number of large trees predicts total biomass and total carbon storage. Given the number of large trees, it is possible to estimate the total biomass and total carbon storage using regression equation.
From the findings, it is evident that large trees have the highest biomass and carbon storage. The plausible biological explanation for the predictive relationship is that large trees have huge biomass, which offer enhanced capacity to store carbon. Ribeiro et al. (2013) state that large trees have woody biomass, which store sequestered carbon.
The statement means that large trees provide an important structure in ecosystems because they sequester carbon from the atmosphere and store it in their woody biomass. From the findings, it is apparent that the carbon storage and the number of large trees have linear relationship, which the biomass determines.
The number of trees has multiple predictive relationships with percentage of plant litter cover, percentage of live plant cover, and the number of fallen branches. Regression analysis indicates that there is a moderate positive relationship between the number of trees and the percentage of plant litter cover (R2 = 0.6298).
The plausible biological explanation for the predictive relationship is that trees constantly shed their leaves and twigs. Sheley, Vasquez, and Hoopes (2009) argue that trees have extensive litter cover because they have a high turnover rates of their foliage. In contrast, the number of trees has a moderate negative relationship with the percentage of live plant cover (R2 = 0.5365).
The plausible biological explanation is that trees prevent the growth of understorey vegetation (McElhinny et al. 2005). Hence, the higher the number of trees, the lower the percentage of live plant cover. The high density of trees affects the structure of understorey vegetation by preventing entry of sunlight using their canopies (Paul et al. 2013).
Regression analysis also indicates that there is a moderate positive relationship between the number of trees in patch and the number of fallen branches within the patch (R2 = 0.5365). The plausible biological explanation is that high density of trees leads to poor growth, which make trees susceptible to disturbances such as wind and storm.
The number of shrubs predicts the number of fallen branches. Regression analysis shows that there is a moderate positive relationship between the number of shrubs and the number of fallen branches (R2 = 0.5511). The plausible explanation for the predictive relationship is that high density of shrubs leads to poor growth of shrubs, which make the fragile and delicate.
According to Roberts (2004) congested shrubs are susceptible to disturbance because competition for nutrients, light, and space makes them weak. Therefore, shrubs are the weakest plants because they have fragile stems and branches.
Large trees and trees are dominant structural variables of a vegetation, which create forest habitat for animals and understorey plants. Sheley, Vasquez, and Hoopes (2009) argue that trees produce litter and shade, which influence evaporation, decomposition rate, microbial activity, temperature, cycling of nutrients, and germination of seeds.
In this view, trees have a profound effect on habitats of understorey plants and animals. Shrubs provide scrubland habitat, where understorey plants and animals receive enough sunlight. To provide a range of different habitats, the vegetation structure of the reserve requires manipulation such as separation of large trees, small trees, and shrubs to form different habitats, and their combinations to form different habitats.
Conclusion
The vegetation structure of vegetation patches that are in the Gardners Creek Reserve have different structural variables. The number of large trees predicts total biomass and total carbon storage, the number of trees predict the percentage of plant litter cover, percentage of live plant cover, and the number of fallen branches, and the number of shrubs predicts the number of fallen branches.
These relationships mean that trees comprise an important structural variable because it can predict the percentage of plant litter cover, percentage of live plant cover, and the number of fallen branches in the reserve, hence, effectively applied in the management of the reserves.
References
Lawley, V, Lewis, M, Clarke, K & Ostendorf, B 2015, ‘Site-based and remote sensing methods for monitoring indicators of vegetation condition: An Australian review’, Ecological Indicators, vol. 30, no. 1, pp. 1-12.
McElhinny, C, Gibbons, P, Brack, C & Bauhus, J 2005. ‘Forest and woodland stand structural complexity: Its definition and measurement’, Forest Ecology Management 218, no. 1, pp. 1-24.
Paul, I, Roxburgh, H, England, R, Ritson, P, Hobbs, T, Brooksbank, K, Raison,.J, Larmour, S, Murphy, S, Norris, J, Neumann, C, Lewis, T, Jonson, J, Carter, L., McArthur, G, Barton, C & Rose, B 2013, ‘Development and testing of allometric equations for estimating above-ground biomass of mixed-species environmental plantings’, Forest Ecology and Management, vol. 310, no.1, pp. 483-494.
Ribeiro, N, Matos, C, Moura, I, Washington-Allen, R & Ribeiro, A 2013, ‘Monitoring vegetation dynamics and carbon stock density in Miombo woodlands’, Carbon Balance and Management, vol. 8, no. 31, pp. 1-9.
Roberts, R 2004. ‘Response of the herbaceous layer to natural disturbance in North American forests’, Canadian Journal of Botany, vol. 82, no.1, pp. 1273-128.
Sheley, R, Vasquez, E & Hoopes, C 2009, ‘Functional group responses to reciprocal plant litter exchanges between native and invasive plant dominated grasslands’, Invasive Plant Science and Management, vol. 2, no. 1, pp. 158-165.
Vesk, A & Nally, M 2006, ‘The clock is ticking: Revegetation and habitat for birds and arboreal mammals in rural landscapes of southern Australia’, Agriculture, Ecosystems and Environment, vol.112, no. 2, pp. 356-366.