Company Overview of Mattel Corporation
In 1945, two entrepreneurs established Mattel Corporation with small range of product line, but now, it is the largest Toy Company in the world. According to the report of Gamache, et al (2), the name of this company derived from two founders.
At the initial stage of formation, this company only manufactured picture frames and dollhouse furniture for the customer though the owner intended to diversify products and concentrated on the new products development to increase profit margin. However, the management of this company had changed its strategies over time considering the influence of pop culture on the society, and change of customer behavior.
In addition, the management team also considered the suggestion of the outside members, for instance, it had introduced three-dimensional doll “Barbie” because Elliot’s wife (one owner) suggested this idea for the development of the company and now this company generated 50% profits from this product (Gamache, et al 2).
Important Historical Milestones
The most important historical milestones has included in the following table.
Table 1: Important Historical Milestones of Mattel. Source: Self generated from Gamache, et al (2) and Mattel (1-11).
Product Offerings
Mattel was started its operation with only two products and the core products were Barbie, Fisher Price and Hot Wheels; however, it is now diversifying its business and introducing too many new products, such as, software interactive software for computer games and activities.
Major Competitors and Their Relative Market Share
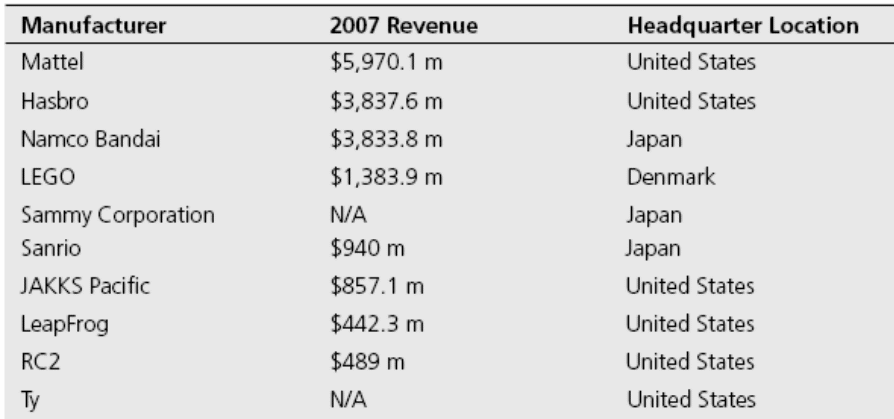
Teagarden (3) said that only few companies lead the market though there are more than nine hundred players in this industry; however, the following figure compares the profits of the major competitors –
The Major Strengths & Weaknesses Using Financial Ratio
Gross profit margin
There has been a slow gradual decrease in the GPM of Mattel throughout the above stated period, and decreasing gross profit margin could indicate that variable costs have risen while selling price has remained constant; or even, it could also mean that Mattel has cut prices to make an augmentation in sales; falling GPM; therefore, is a major weakness here.
However, to certain extent, the GPM was better in 2007 in comparison with the past year and this rise could mean that the corporation had good pricing strategy essentially in that year (probably, Mattel was proficient to lift prices with small or no consequence on sales) or that it possesses an intensifying productivity
Net Profit Margin
Mattel’s NPM is also weak and quite instable throughout the period and it has lowered in 2007 than the previous year – lowering net margin means that the firm is not generating enough sales or it is not keeping the operating-expenses under control; conversely, in 2005 the position of the NPM was the worst
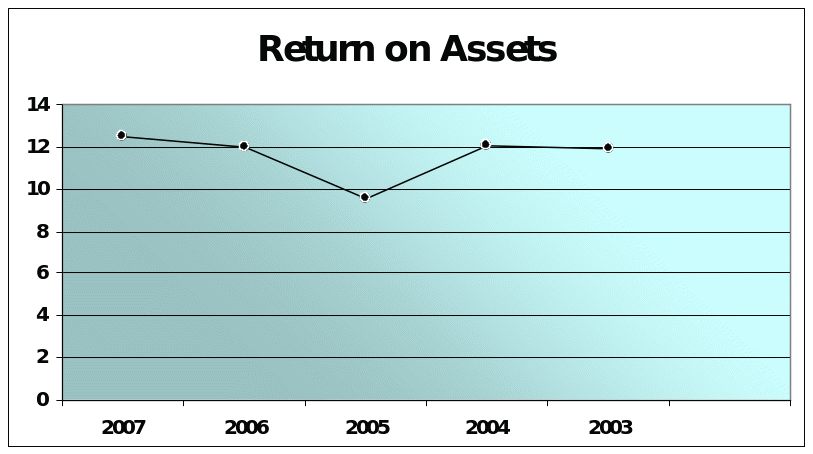
Return on Assets (ROA) of Mattel
Table 2: Return on total assets of Mattel. Source: Self generated.
Although Mattel’s ROA has fluctuated in the above-stated years, it was in quite attractive in 2007 because rising return on assets could symbolize the fact that the firm is proficiently handling its assets to engender earnings; in addition, the higher this figure is the more efficient this corporation is in exploiting its assets; therefore, it is strength of Mattel
Return on Assets (ROA) Hasbro Inc:
Table 3: Return on total assets of Hasbro. Source: Self generated from Hasbro (7).
Return on Assets (ROA) JAKKS
Table 4: Return on total assets of JAKKS. Source: Self generated.
Return on Assets (ROA) Leap Frog
Table 5: Return on total assets of Leap Frog. Source: Self generated.
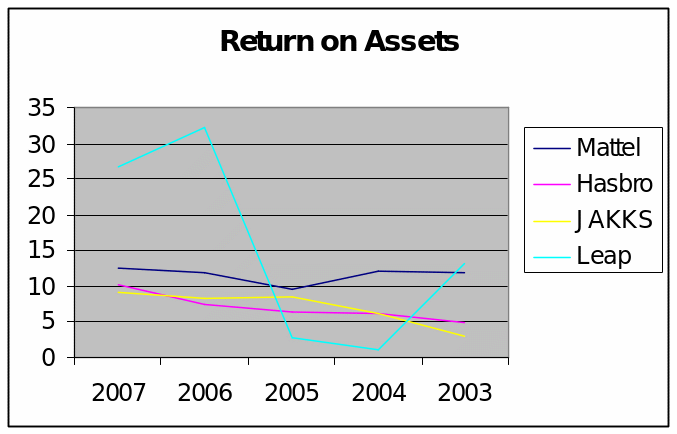
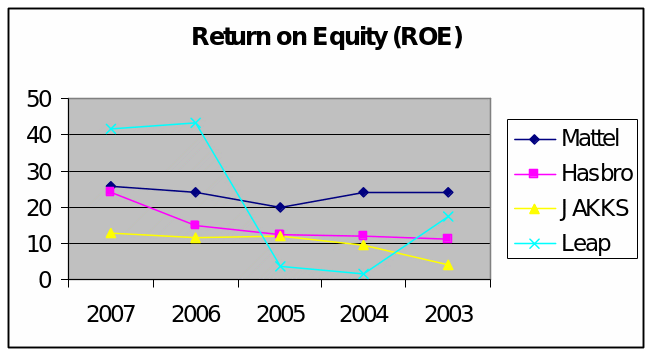
Return on Equity (ROE) of Mattel
Table 6: Return on total Equity of Mattel. Source: Self generated from Mattel (78).
Return on equity of the company has satisfactorily increased in 2007 than the past years, which is showing that the company has profitably engendered revenue from the cash shareholders have expended particularly in that year; this is once again screening its financial strength
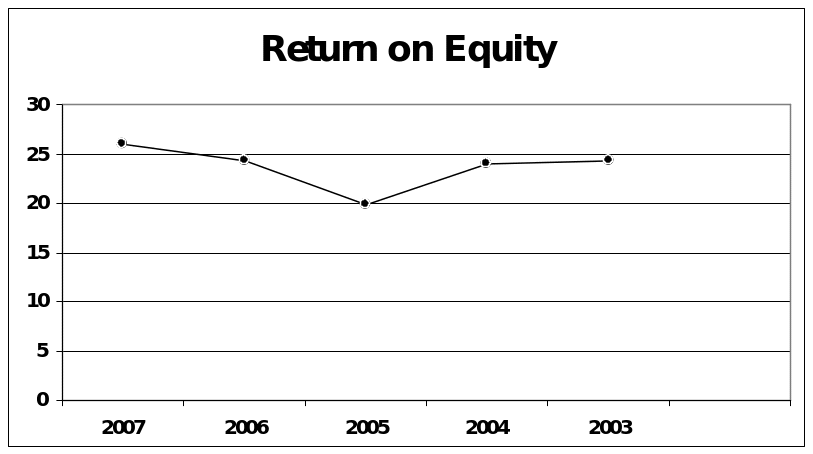
Return on Equity (ROE) of Hasbro
Table 7: Return on total Equity of Hasbro. Source: Self generated.
Return on Equity (ROE) of Jakks
Table 8: Return on total Equity of JAKKS. Source: Self generated Jakks (165).
Return on Equity (ROE) Leap Frog
Table 9: Return on total Equity of Leap Frog. Source: Self generated from Leap Frog (87).
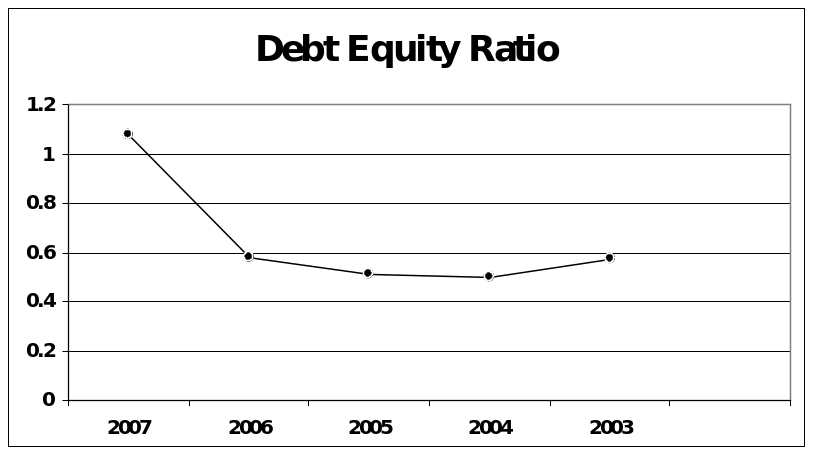
Debt Equity Ratio of Mattel
Table 10: Debt Equity Ratio of Mattel. Source: Self generated.
In comparison with the past four years, the Debt Equity Ratio of Mattel was higher in 2007 signifying the fact that the corporation was aggressive in funding its expansion with liabilities, which in turn could have caused impulsive income for Mattel in that financial year; therefore, this could be a major weakness of the company
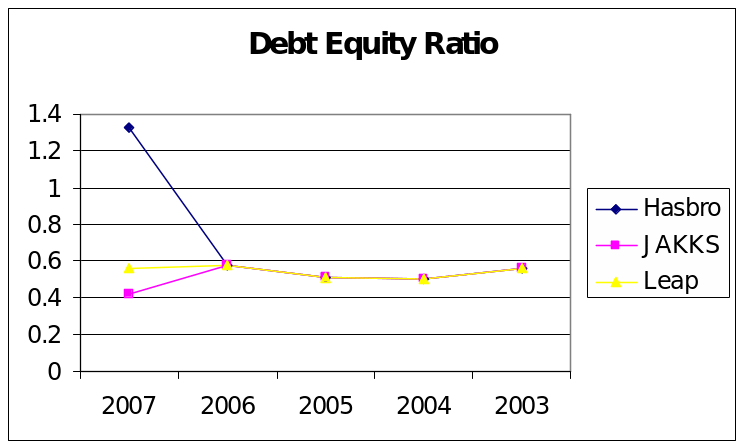
Debt Equity Ratio of Hasbro
Table 11: Debt Equity Ratio of Hasbro. Source: Self generated.
Debt Equity Ratio of Jakks
Table 12: Debt Equity Ratio of JAKKS. Source: Self generated.
Debt Equity Ratio of LEAP FROG
Table 13: Debt Equity Ratio of Leap Frog. Source: Self generated.
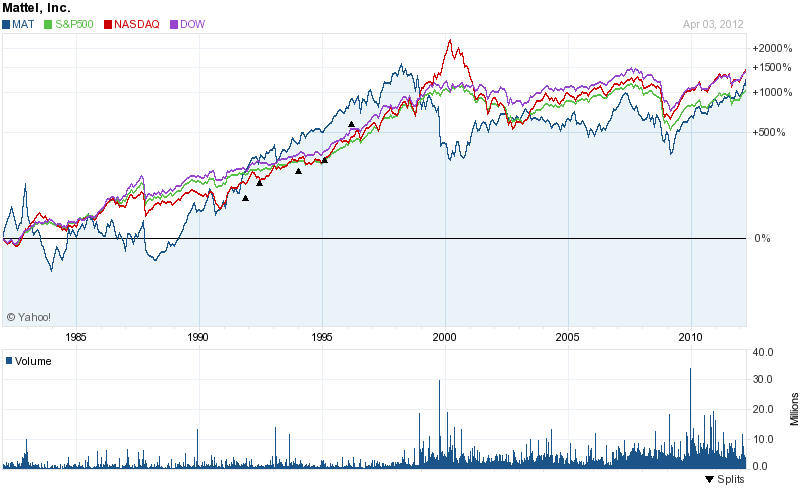
The historical stock price performance of the company and its top three competitors
According to the Yahoo Finance (1), Mattel share price always a flexible position in the stock market though at the initial stage, the share price of this company was below $1, which increased gradually and hold its strong position. In addition, Yahoo Finance reported that it increased up to $2 within 2010 and at present, per share price is $2.8; however, the following figure shows that historical stock price of Mattel in three stock exchanges –
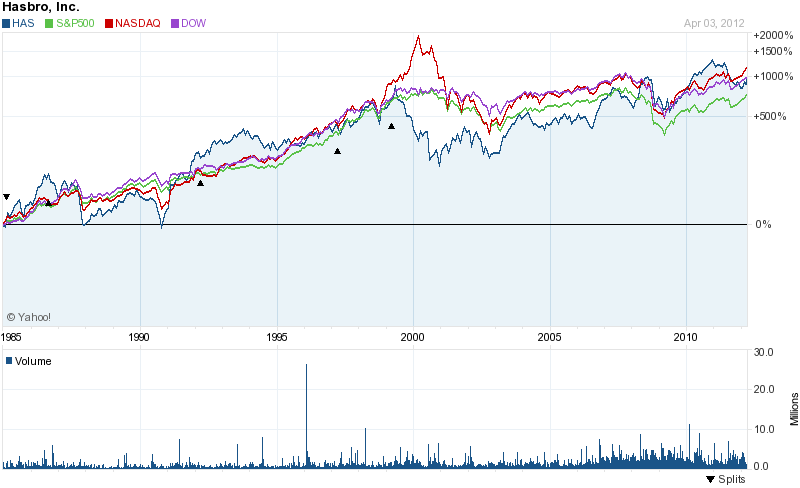
Hasbro
On the other hand, the share price of Hasbro was in stable position from the fiscal year 1995 and it is gradually improving like the Mattel –
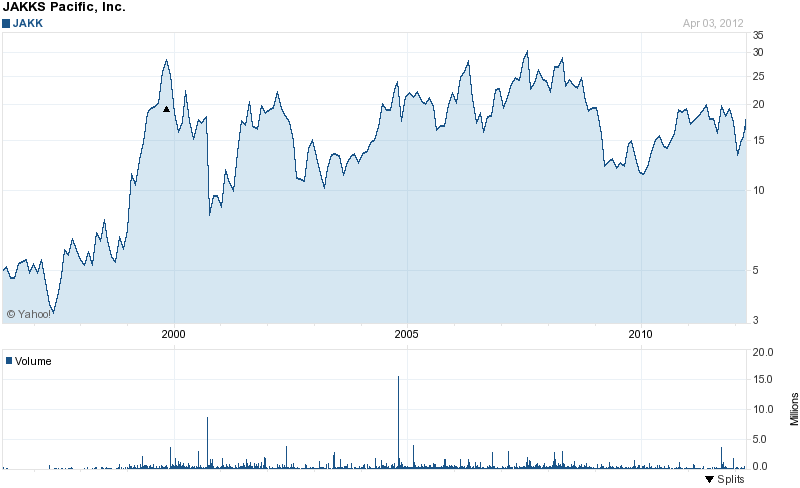
Jakks Pacific
At the initial stage, the position of Jakks Pacific was not satisfactory level, but it has become successful within few year of its operation and the following chart shows thia issue –
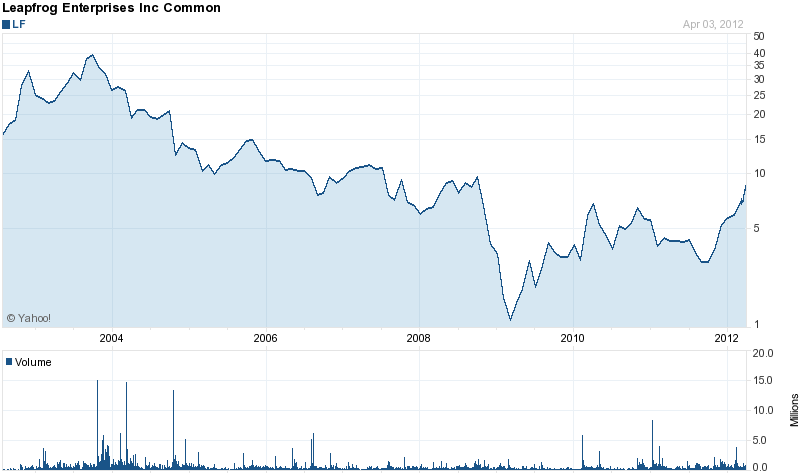
Leap Frog
According to the following figure, the position of this company was the worst in stock market considering the other three large competitors –
How Does the Competitive Environment Shape the Company’s Strategy
This industry is highly competitive though few companies enjoyed competitive advantage by considering Porter’s five forces and restructured the company, for example, Mattel offered comparatively low price for its products because the rivalry among the companies and threats of substitutes are too high, which influenced the company to take following actions –
- Teagarden (3) stated that Mattel concentrated on the maximizing the value of core brands, such as, Barbie and Hot Wheels;
- It executed an offshore manufacturing strategy in China;
- Companies of Toys industry spend lots of money to create innovative designs.
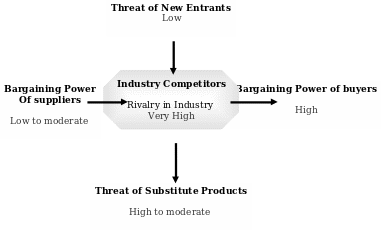
Porter’s Five Forces Analysis on the Toy Industry
The popular five forces model of competition has developed by Michael E. Porter and he mentioned these five factors format each industry; however, the next figure demonstrates the Porter five forces model for the toy industry –
Threat of New Entrants
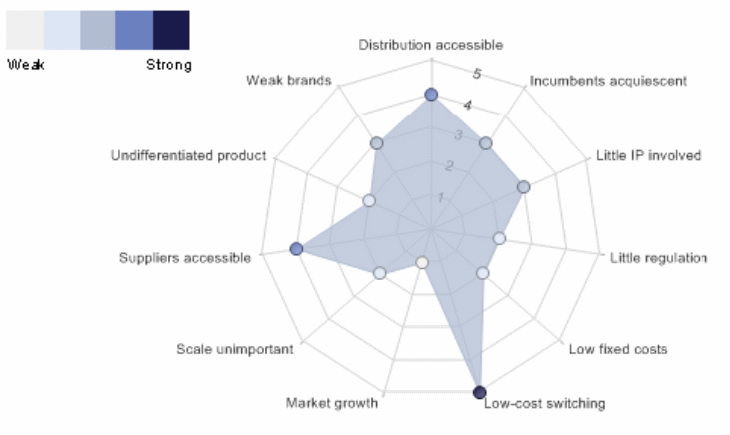
In general, the existing companies in the industry are not the only threatening aspect for the firms, but the potential newcomers can also cause of competitive challenges in the free market economy, for instance, Chinese companies can enter the US toy market easily and can offer low price of the products.
However, it is easy for the establish companies like Mattel and Hasbro to introduce new item or enter new market with competitive advantages, but it is hard for the new company to capture large market share in the toy industry; therefore, there is no doubt that new companies would be able to enter the market, but must face intense competition.
At the same time, new companies have to suffer in several problems, for instance, cost disadvantages, limited profits and building relationship with suppliers and customers, design of the products, presence of numerous distribution channels, need efficient human resources and huge investment, legal barrier to introduce patented products, and so on. However, the following figure shows the factors those influencing the new entrants of this industry –
Bargaining Power of the Suppliers
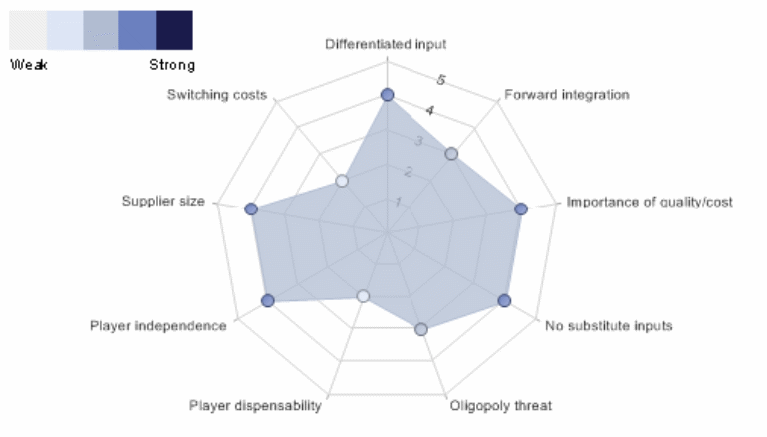
This force is varying for the different companies considering size, market share and financial position of the companies, for instance, small companies need contract with high price and condition while large companies like Mattel has the capability to select the supplier with the lowest price. However, next figure discusses the key driving force of the suppliers in this industry, for instance –
Power of Buyers
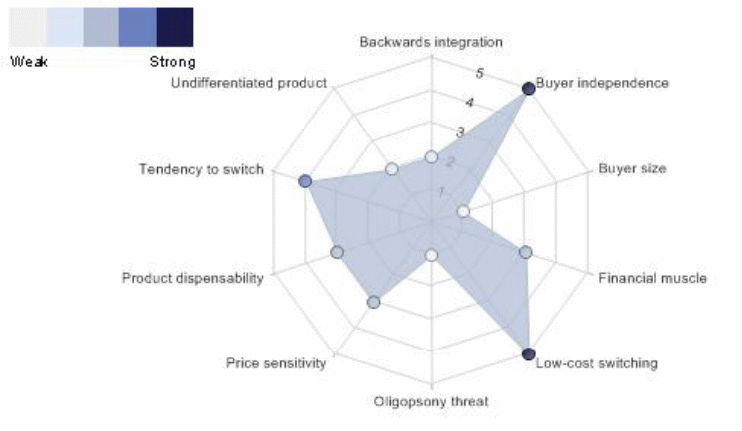
Bargaining power of the buyers depend on several factors in the toy industry, such as, price sensitivity, product differentiation, buyer independence, low switching off costs, and so on; however, this scenario is different for the large companies like Mattel because of brand awareness of the products. However, next figure demonstrates drivers of buyer power of this industry, for instance –
Threat of Substitute Products
Most of the companies in this industry are trying to produce innovative products using modern technology, which change the customer behavior and increase market demand, for instance, introduction of Barbie doll was a successful strategy for Mattel, but children are like to playing with computer games, which can be treated as substitute products of traditional products.
Intensity of rivalry
Rivalry is very high because of the number of competing companies (more than 900 companies engaged in the production of toys) and all the competitors are taking innovative approach to expand business in the new market, develop brand image, and increase customer base to sustain in the competitive market.
The core problems driving the “toy recall crisis
From the given case, it has evidenced that the leadership crisis is the core problem of the company Mattel, but the ‘toy recall crisis’ has generated by the complex supply networks of China; rather than the company’s own core problems.
Mattel had organized almost 3,000 small and medium partners China for toy assembling who conducted incredible research to design and development product and marketing them to the other toy companies with cost effective solution as their strategic importance.
The unethical profit making with cost effective solution by the Chinese companies and their shift from straightforward assembly to the high value-added manufacturing adopting their gained knowledge turned them to use excessive level of lead in their manufactured products and the investigation of US Consumer Products Safety Commission (CPSC) bring this product harms into the public view that urged Mattel for toy recall.
The company’s value chain and Supplier Relationships
A large number of the Chinese toy vendors have enjoyed strong business alliance with Mattel, but the toy recalling due to unethical shifts of them has seriously hampered the supplier’s relationships with Mattel; moreover, customers of US market hasn’t rendered any further confidence on Chinese manufacturers, so, there is no scope to prolong the existing value chain and supplier relationships.
How should Mattel handle the “toy recall crisis -Short-term and long-term strategies
Shang (2010) pointed out that the involuntary recalling take place while any company necessary action for its product harms after the regulatory agency direction or force to comply with the dogmatic responsibility to meet consumer’s safety requirement, such alignment of product recalling would generate the customer’s perception that the company does not care for customers.
It would not be fair for such a company as if Matte to wait for involuntary product recalling, as it would hamper the company’s long-term reputation by destroying brand trust.
Among the four strategy of product recalling, Matte has adopted voluntary product recalling strategy harm crises, it is thus essential for Matte to adopt one more strategy either denial strategy to introduce new product as alternative brand that would help to reduce great lose or emphasis on super effort strategy to maximize existing brand loyalty.
Chen et al. (2) pointed out that enlarged incidence of product recalling would potentially distressing the financial performance of the company and to deal with such crisis, there are four types of product recalling strategies such as denial strategy, involuntary recalling strategy, voluntary recall strategy, and super-effort strategy.
Among the four strategies the company would identify any of them or more than one that it feels to contribute early recovery and sustainability in the market while denying to comply with the regulatory guideline would impose legal barrier on the operation and generate customers complain.
Thus, the companies with higher CRS level possibly would align with voluntary recalling to generating positive perception among the customers and stakeholders, such companies consider the voluntary recalling as part of their corporate social responsibility and start propagation to touch the loyalty of customers towards the brand.
On the other hand, frequent large volume of recalling may destroy the competitiveness and threaten the over all performance in long-term, there is no clear prediction whether provocative or passive which involvement would assist the company to sustain its regular growth and do not impact on the firm value.
Thus it is would be wise for Mattel to align with both provocative and passive involvement with product recalling strategy, the practice of a mixed strategy would provide time to make further decision depending on the market response.
The current “toy recall crisis” affect the long-term competitiveness
Yes, I think that the current toy recall crisis of Mattel would affect the long-term competitiveness of the company result in product recalls, as the company would suffer from noteworthy impact on its reputation, reducing sales volume would trim down the revenue generation, share price would fall, and financial value of the firm would deteriorate.
In respond to regulatory findings of safety hazards incorporated with its product, although, Mattel has carried out voluntary recall through a provocative strategy, regardless to their willingness to carry out the burden of liability at their own account, the passive strategies would bring further negative effect on the company’s value.
At the same time the stock market traders and investment consultants would consider such strategy as a serious indication of large financial loose of Mattel and they would advice their client to withdraw their investment from the company, thus, product recall of Mattel has the possibility to encounter with investment crisis.
Although the theoretical explanation has argued that, there the provocative strategy would generate positive perception of the customers regarding the high quality of CRS at Mattel, but in practice while customer would see the Mattel’s product, their mindset would reflect that the company produce faulty products and turn to choice any other alternative brand.
Moreover, the critic review published in the Wall Street Journal on September 11, 2007 regarding the toy recall crisis of Mattel has poured fuel into fire that would seriously hamper the reputation of the company and customer would carry negative perception for long run without giving any credit to the quick recalling actions for the defective toys.
It would be difficult for the company to get any quick recovery from the crisis as if there is any possibility to get back the customer’s confidence for brand loyalty, but the investors may not compromise with reducing profitability; consequently, the recall event would negatively affect the overall performance of the company.
From the given case, it has demonstrated that the growth of the company was accelerated unexpected during 1997 due to the Mattel’s offshore manufacturing strategy in China, due to the toy recall crisis of Mattel in 2007; it has postponed the Chinese network of large Chinese suppliers and it would generate further complicacy with the product supply.
The real scenario of US toy market is that it is a US$ 24 billion market where 86% comes from China where Mattel enjoys an extensive supply chain of Chinese manufacturers, if this network breakdown due to the toy recall crisis, it would be very difficult for the company to reconstruct them.
Moreover, the Chinese manufacturers may not wait for long time for the recall crisis of Mattel, but build up new contract with the new buyers or they move their simple assembling to high-end technology application, thus in long run the company would loose it competitiveness with sever financial and physical loose.
Thus, I would like to conclude that for toy recalling crisis of Matte, the proactive strategy would entertain with superior investor’s concentration, as the stock market analytics would interpret the product recalling strategy as an indication of momentous financial losses that negatively linked with the long term financial value and the company would loose its competitiveness in long-term.
Works Cited
Chen, Yubo. Ganesan, Shankar & Liu, Yong. 2012, Does a Firm’s Product-Recall Strategy Affect Its Financial Value: An Examination of Strategic Alternatives During Product-Harm Crises. Web.
Datamonitor 2012, Toys & Games in the United States. Web.
Gamache, Justin, Jessica Levstik and Sarah Lutz. 2011, Premier Toy Brands: Today and Tomorrow. Web.
Hasbro. Annual Reports. 2007. Web.
Jakks. Annual Reports. 2007. Web.
Leap Frog. Annual Reports. 2007. Web.
Mattel. Annual Reports. 2007. Web.
Mattel. Mattel History. 2007. Web.
Shang, Zhou. 2010, Does Denial Drive Distrust? –An Analysis of Responses to Product-harm Crises in New Zealand. Web.
Teagarden, Mary. 2008, Mattel’s China Experience: A Crisis in Toyland. PDF file. 03 April 2012. Thunderbird School of Global Management, Beijing.
Yahoo Finance. Direct Competitors of Mattel. 2012. Web.
Yahoo Finance. Historical stock price performance of Hasbro. 2012. Web.
Yahoo Finance. Historical stock price performance of Jakks Pacific. 2012. Web.
Yahoo Finance. Historical stock price performance of Leap Frog. 2012. Web.
Yahoo Finance. Historical stock price performance of Mattel. 2012. Web.