Abstract
Understanding the growth patterns of cell cultures is of crucial practical importance for laboratory, industrial, and technological processes. An integral part of bacterial cultures is the generation time, which determines the ability to double during each time interval: determining the minimum value of this time for an inoculated E. coli culture was the main task of this laboratory work. This was done for the present laboratory work using the traditional method of turbidimetry, which quantifies the absorbance of a sample by measuring the amount of light that passes through it. In addition, the calculation of cell density using the method of successive dilutions was conducted, and the effect of using two antibiotics for sensitive and drug-resistant cultures of E. coli was revealed.
Introduction
Bacterial growth follows an exponential trend: this means that the number of microorganisms is constantly increasing at a high rate. Such growth can be dangerous to maintain effective health care because it characterizes the rapid development of microorganisms. The use of antibiotics can be an effective solution against them, but different types of antibiotics have different effects on inhibiting bacterial growth. For this reason, it is critical to make decisions about the use of antibiotics based on data and a specific strain of bacteria. The present laboratory work uses a bacterial culture of E. coli, which can cause food poisoning. For the bacterium, the generation time during which the number of microorganisms doubles is studied using a spectroscopic method. In addition, different combinations of two antibiotic agents, Ampicillin and Kanamycin, are used to test their inhibitory effect on the growth curves of bacterial cultures. The results of this work will determine the minimum time required to double the E. coli as well as determine the potential of antibiotics to inhibit their growth.
Methods
The methodological basis for performing this work was investigating bacterial seeding density’s dependence on inoculation time. For this purpose, 3 mL of pure dense E. coli culture grown on an LB-agar plate was carefully transferred to a flask, and the flask was placed in a shaking incubator (t = 37.0 °C). Approximately every twenty minutes, absorbance was measured for the sample using a spectrophotometer. The choice of these time values was motivated by the desire to take density readings for each generation since, according to the instructions, E. coli colonies double about every 20-40 minutes. The absorbance and elapsed time results since inoculation were recorded in Table 1, which was used for further analysis. To calculate the bacterial density, the 10x serial culture dilution method was used, which means that 10 μL of cells were added to 90 μL of solvent.
Ampicillin and Kanamycin were used to evaluate the effect of antibiotics on the growth and behavior of the bacterial culture, which destroys the cell wall and ribosomes of E. coli, respectively. Both antibiotics inhibit growth opportunities for the bacterium, so it was interesting to use them to evaluate the effect on generation time. The E. coli culture (75 µL each) was divided into three experimental groups depending on the method of intervention. The first group (E. ColiS+ AMP, #1) was treated with 1.5 mL Ampicillin, and the second group (E. ColiS+ KAN, #2) was treated with 75 µL Kanamycin. The third group (E. ColiR+ KAN, #3) was resistant to the two drugs and retreated with the same 75 µL Kanamycin to assess resistance to the selected antibiotic. Samples from each of the three tubes were measured for absorbance using a spectrophotometer every 20-30 minutes to allow for growth to the early/mid-log phase.
Results and Analysis
Generation Time
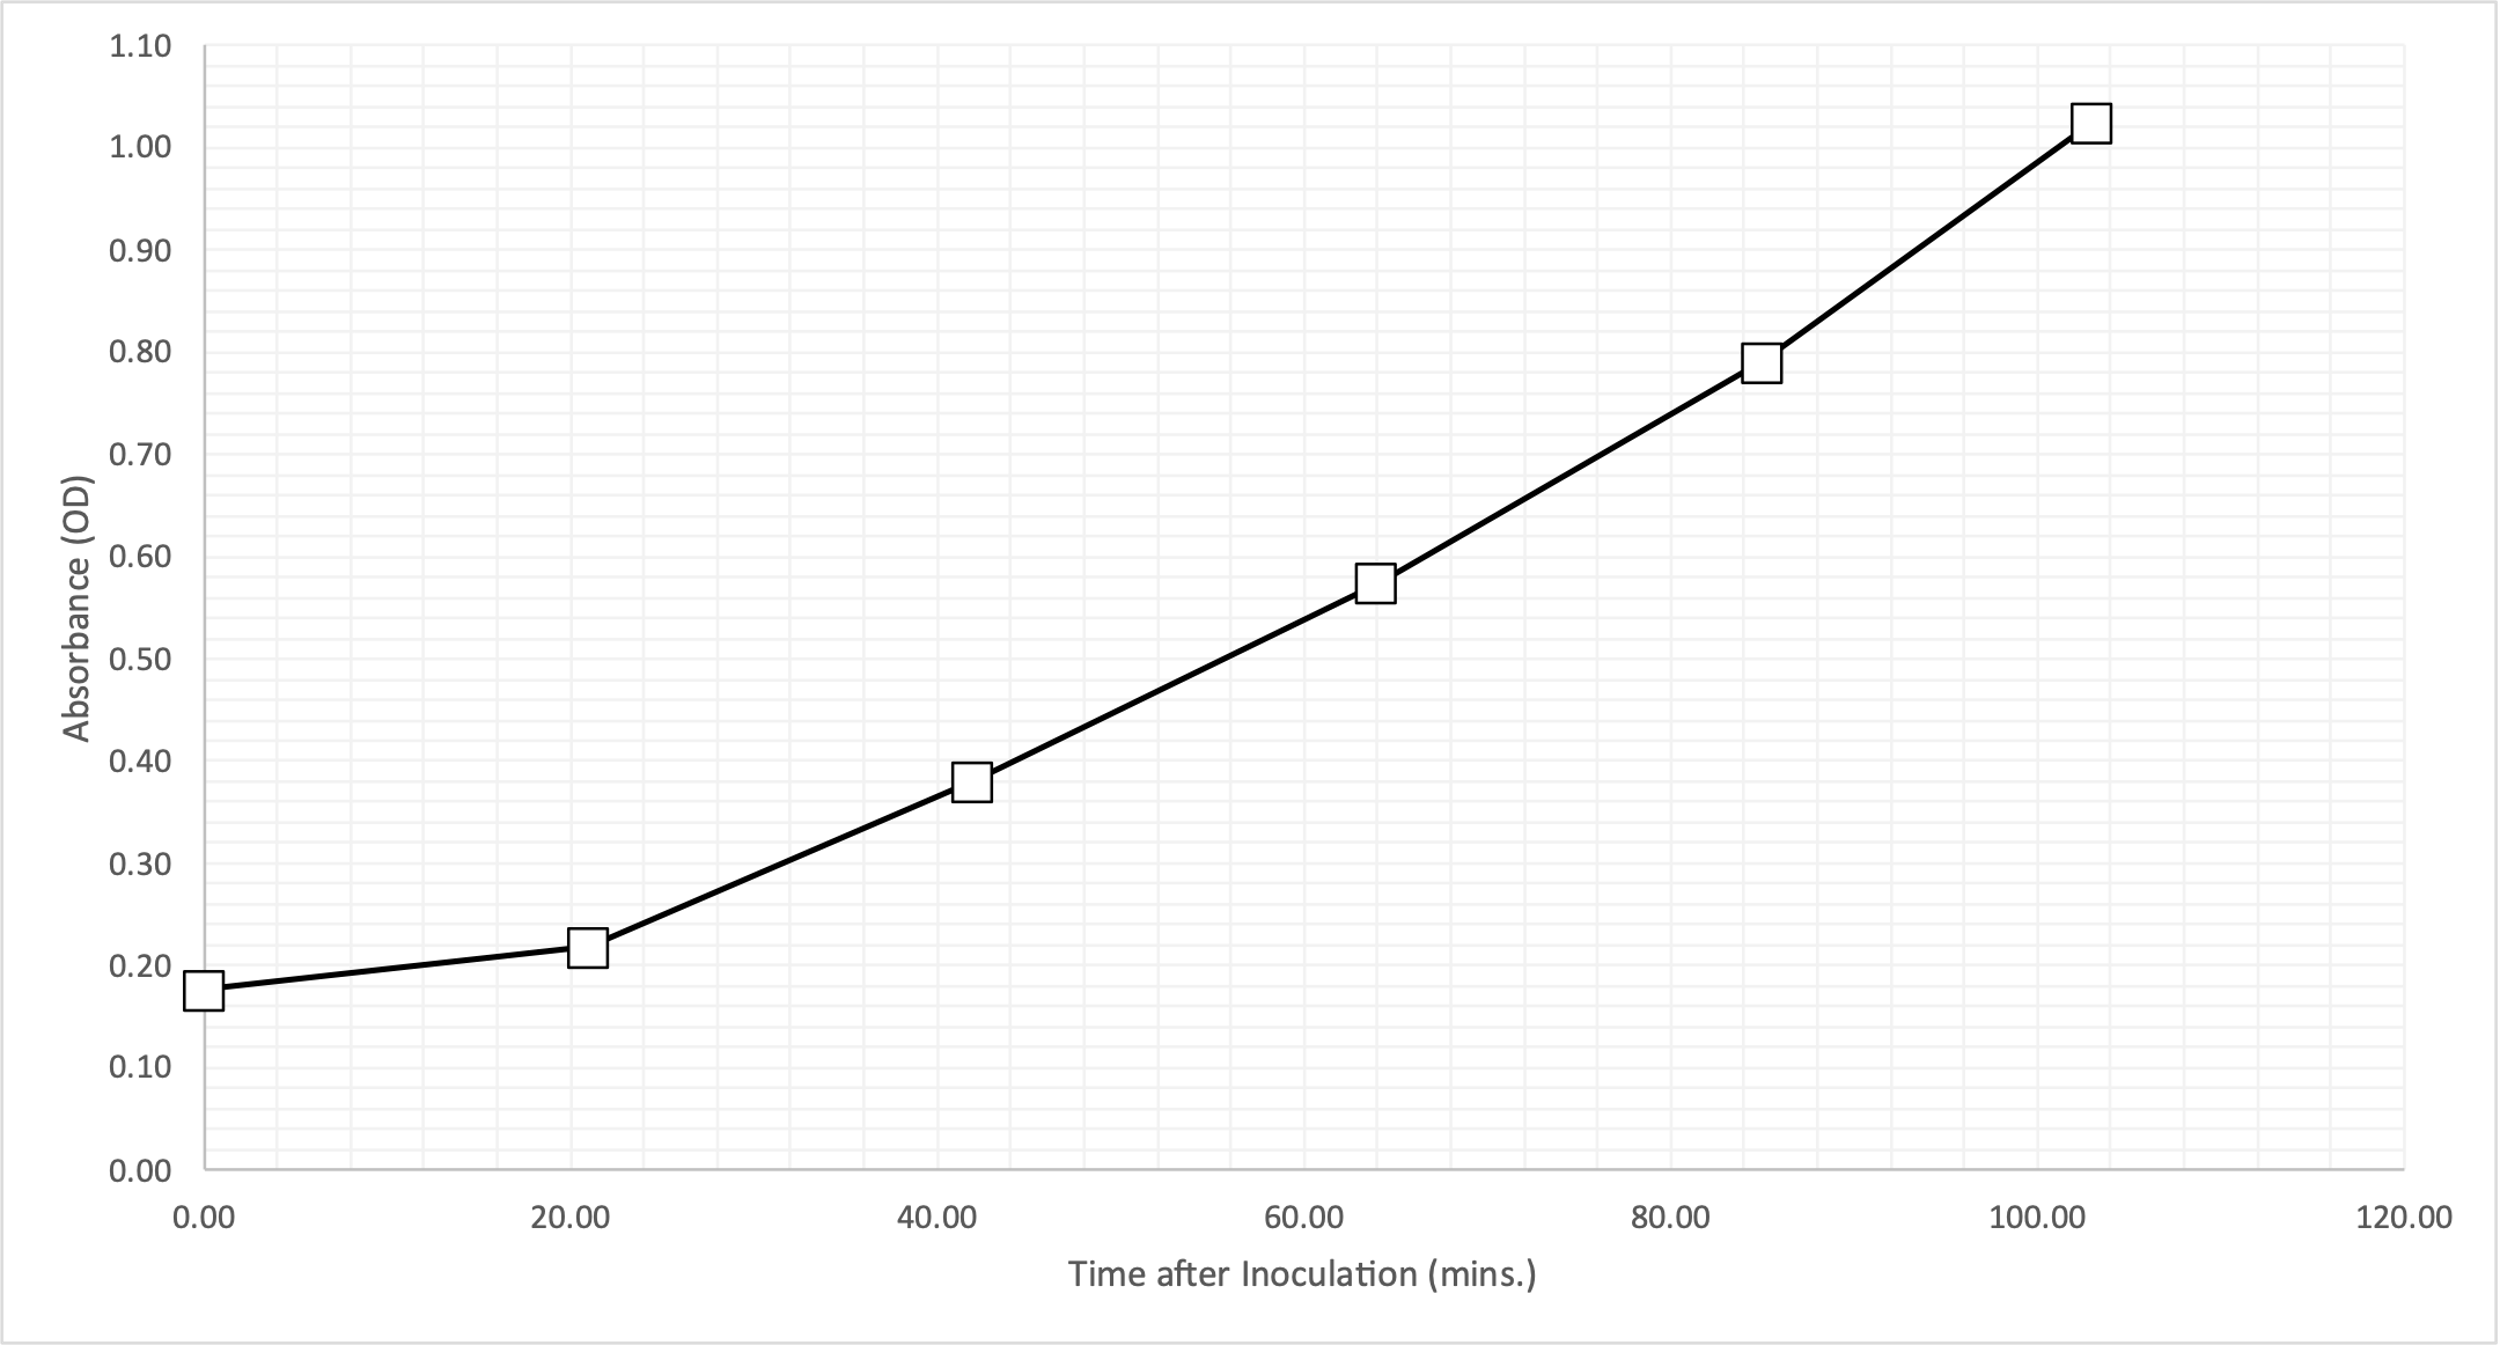
Table 1 shows the raw data obtained by measuring the absorbance for an inoculated bacterial culture approximately every twenty minutes. The elapsed time (in minutes) was calculated by subtracting the end point of the measurement from the starting point, and the fourth column of the table shows these values. Considering the uncertainties, the absorbance data were measured every twenty minutes. In order to study the growth stages of the bacterial cultures in detail, it was necessary to visualize the obtained data on a graph. Figure 1 shows the dependence of culture density on time elapsed since the beginning of inoculation.
Table 1. Results of absorbability measurement depending on the elapsed time
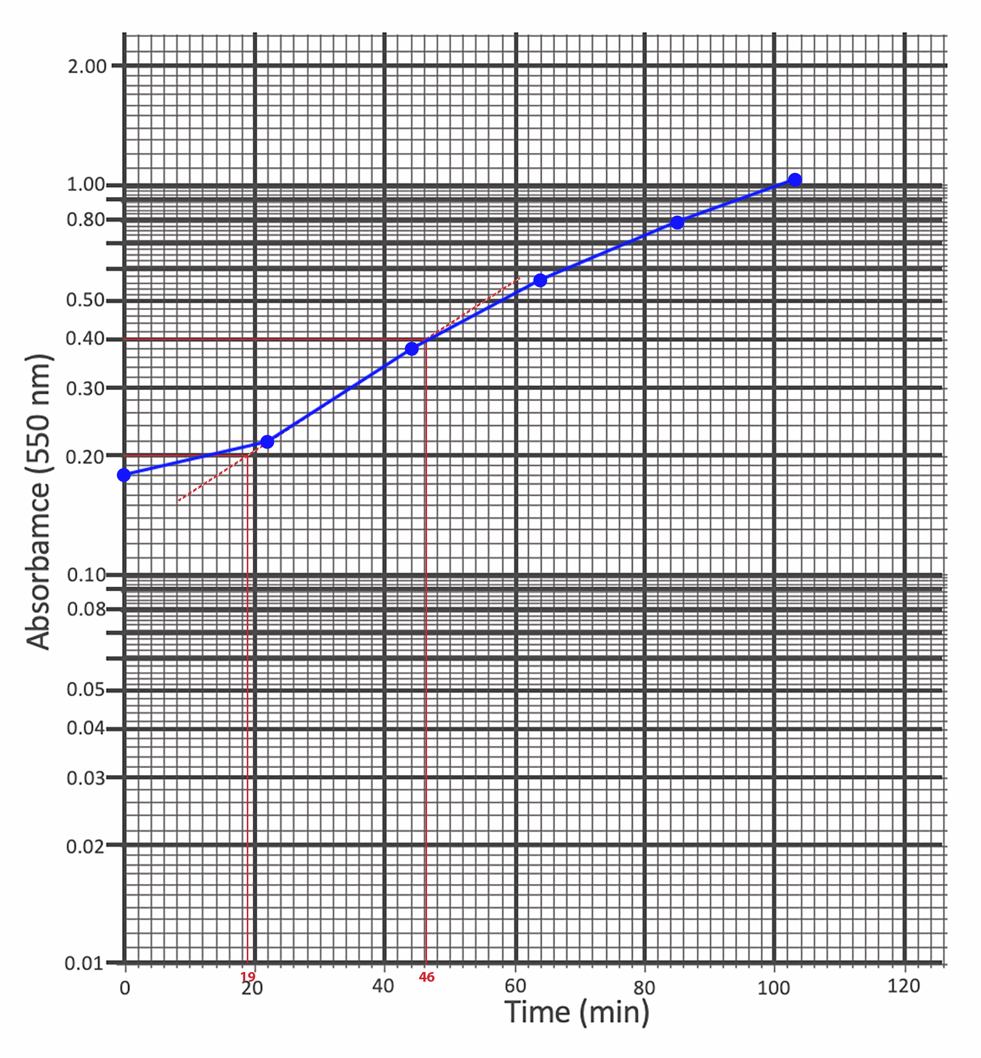
The same data were plotted on a semi-logarithmic scale, as shown in Fig. 2. This allowed the total generation time of E. coli to be determined: the line with the most significant slope was extrapolated, and two straight lines were drawn to the axis of ordinates to obtain points differing precisely by half. The perpendicular from the points of intersection to the abscissa axis allowed us to determine that the time to double the number of cultures for the bacterium is 27 minutes.
Bacterial Density
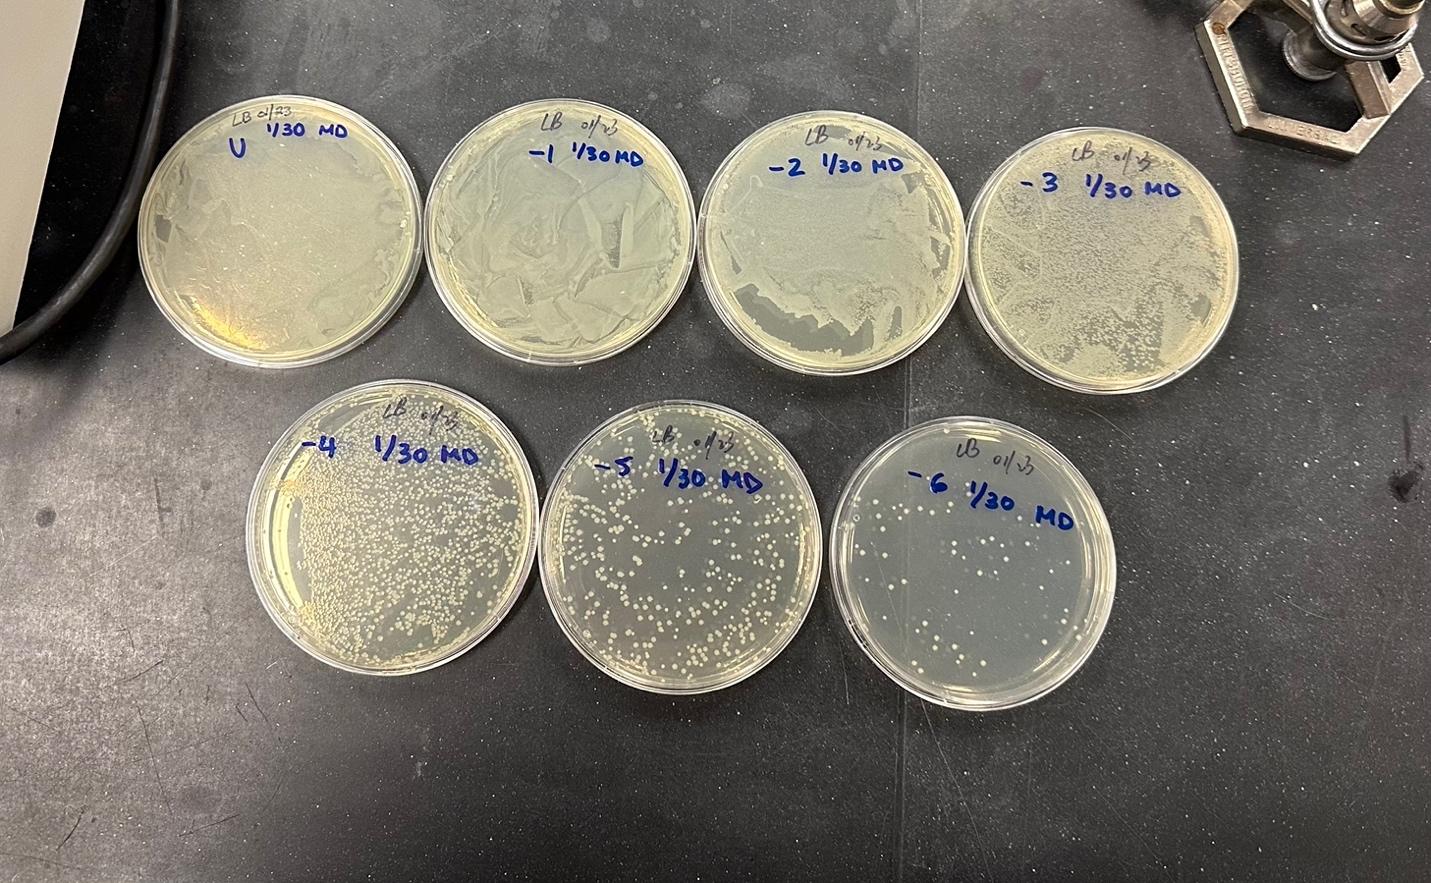
To calculate the bacterial density of E. coli, the serial dilution method was used as shown in Figure 3. The number of colonies on the -6 plate was 60, so the optical density was calculated as 6⋅107 cells/mL.
Effect of Antibiotics
The combination of the two antibiotics and the resistance of the bacteria to them resulted in a matrix, as shown in Figure 4: a total of nine experimental lines. Optical densities were determined for each of the plates in increments of approximately every 20-30 minutes; the results of the direct measurements are shown in Table 2. These data were plotted on a single semi-logarithmic scale in order to examine the growth behavior depending on the method of intervention in more detail.
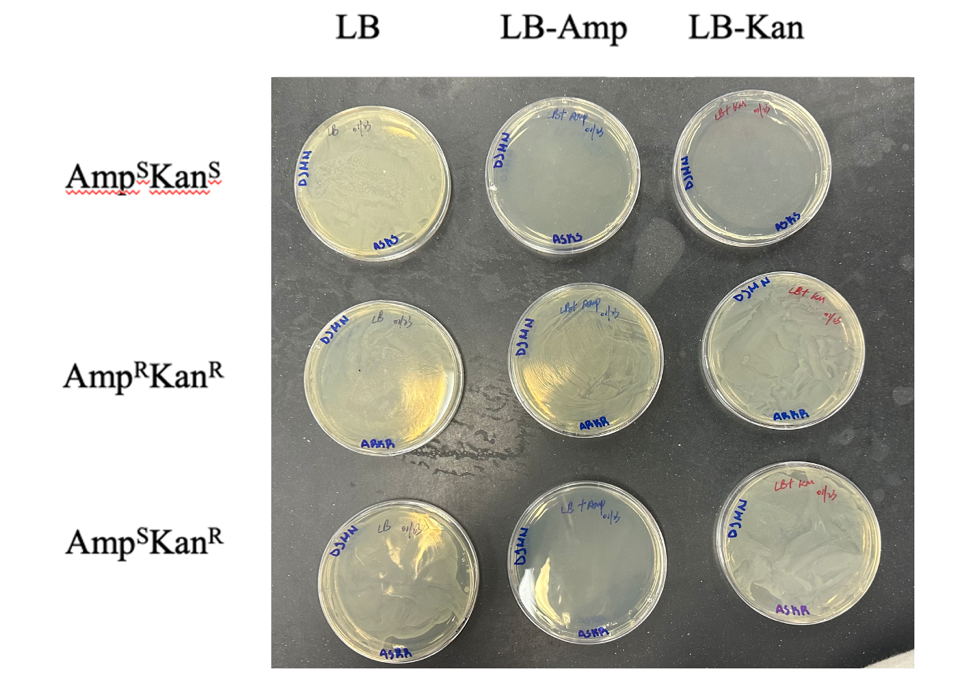
Table 2. Results of direct optical density measurements for E. coli depending on the processing method
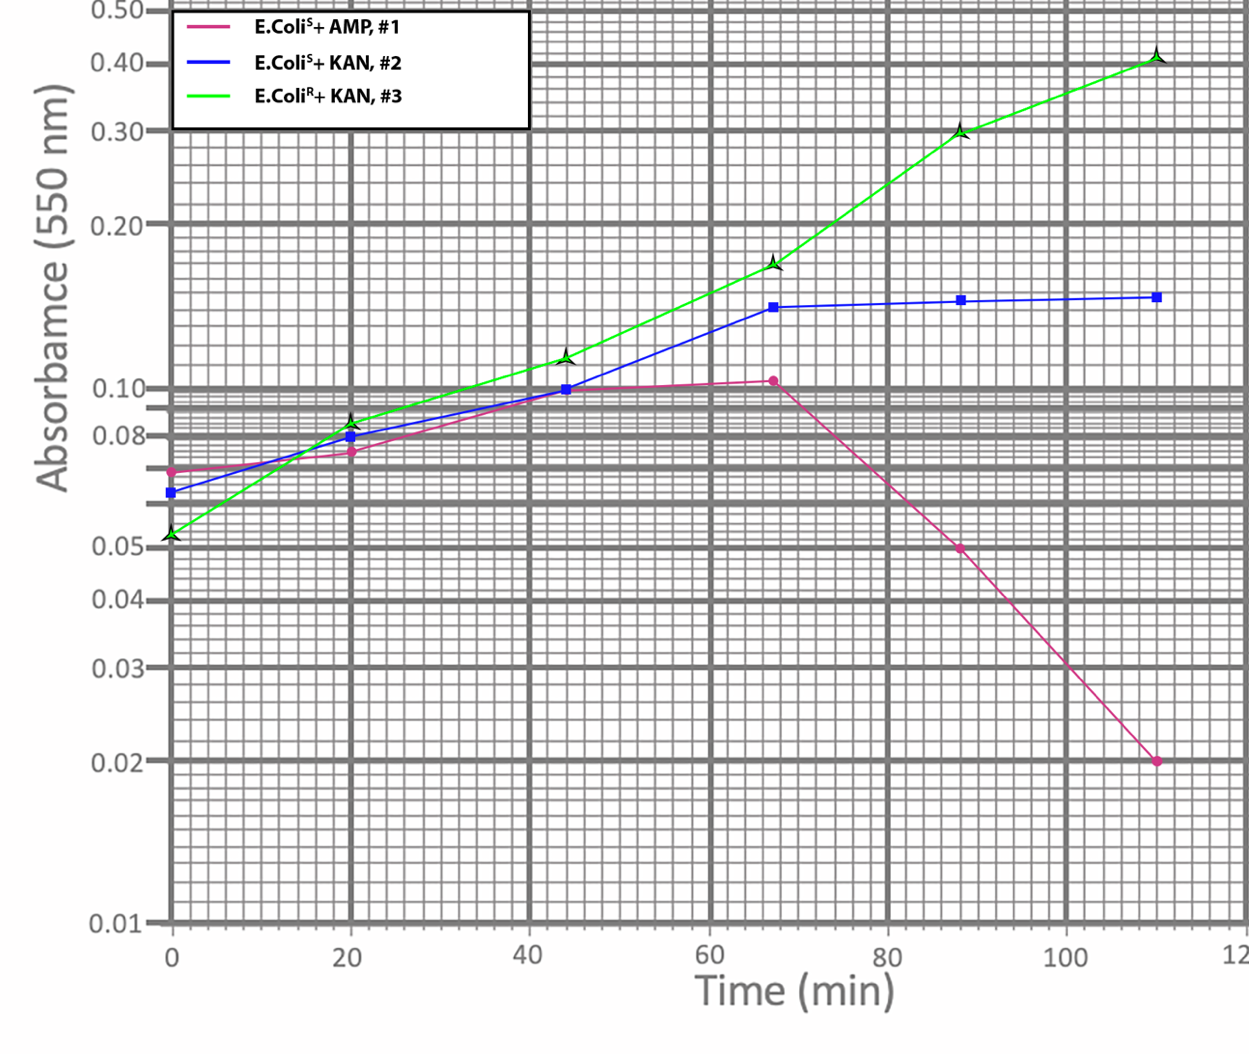
As seen in Figure 5, after adding Ampicillin to E. coli, the growth first slowed and then began to decline, indicating cell death as a result of the drug. The action of Kanamycin was characterized by an exit to a horizontal plateau, indicating that cell culture growth slowed. Finally, the culture resistant to both drugs did not feel the effect of the inhibitory antibiotic and continued growth in the log-phase without reaching stationary.
Discussion
The results of this experiment demonstrate that the minimum time required to double the bacterial culture of E. coli is 27 minutes. Looking at Figure 1, it can be seen that the growth graph of the cell culture has a parabolic upward pattern. Between the first two data points, there was significantly slower growth than for the other pairs — this indicates the presence of the lag-phase when the bacteria are just adapting to the new environment, so there is no significant growth. Further growth patterns can be characterized as the log phase when cells divide rapidly and increase the total cell mass. Since the measurements were limited to the first two hours after inoculation, the Stationary phase was not reached.
Notably, the initial optical density at time zero, T0, was higher than expected. There are several reasons why the culture was initially cloudier than expected. First, the flask in the broth may have been contaminated immediately, which distorted the initial results. Second, the flask had been standing for some time before the first measurement, which may have caused some of the cells to settle, and the sample was taken from the bottom, which also affected the results. In addition, evaluating the effect of antibiotic drugs on cell culture behavior confirmed expectations: resistant E. coli bypassed the obstacle and continued to grow, while sensitive bacteria were adversely affected. Notably, the effect of Ampicillin associated with the destruction of cell walls led to cell death, which is reflected in the semi-logarithmic graph, while Kanamycin, which destroys ribosomes, affected the growth rate and brought this line to a plateau.
Conclusion
The determination of generation time through measuring E. coli cell culture absorbance readings can be called successful, given the results obtained. The study demonstrated that the culture could pass the lag phase, followed by the log phase, but did not make it to the stationary phase due to the limited observation time. The final generation time required for doubling was 27 minutes, providing valuable insight into the growth behavior of the E. coli cell culture. In addition, the work was able to demonstrate the calculation of the cell density of the culture and the effect of antibiotics on sensitive and resistant cultures.