Historical Profitability of the Soft Drink Industry
Since customers are less health conscious today than in past generations, the soft drink industry has been profitable. They consumed a lot of soft drinks as a result. If one were to look at American soft drink consumption patterns, consumption has increased. In 1970, Americans consumed 23 gallons of carbonated soft drinks yearly (Yoffie & Kim, 2010, p. 14). Over the following three decades, this consumption increased by 3% annually, reaching 53 gallons per capita in 2000 (Yoffie & Kim, 2010, p. 12).
Increased Distribution and Volumetric Growth in Soft Drink Expansion
The producers of soft drinks end up making money from this volumetric rise. The increased distribution of these soft drinks, which boosts their volumetric growth, contributes to the lucrative expansion. Developing new soft drinks, such as flavored and diet drinks, creates new growth opportunities for the manufacturers of soft drinks. The prices, adjusted for inflation, have been falling over time, making soft drinks more accessible to customers. More customers mean more significant expansion for the product line. If the industry participants can achieve economies of scale, the low fixed investment required by some will translate into lower fixed costs per unit.
Impact of Lower Variable Expenses on Industry Profitability
Some industry players’ variable expenses, such as labor costs and overhead, are significantly lower, allowing them to further benefit from the decreased costs and boost their profitability. The agreements between business partners, such as merchants, producers, bottlers, and suppliers, tend to favor one party. Because of the nature of the agreements made between the parties, producers could gain much more than bottlers. One of the soft drink industry players is the concentrate producer, whose primary responsibility is to mix the raw components, package them, and transport the semi-finished goods to the bottlers. The members of the industry known as bottlers are those who take semi-finished products and add carbonated water before packing them according to customer specifications. Concentrate producers can make minimal permanent investments in their companies. Therefore, they can carry reduced fixed costs per unit if they achieve economies of scale.
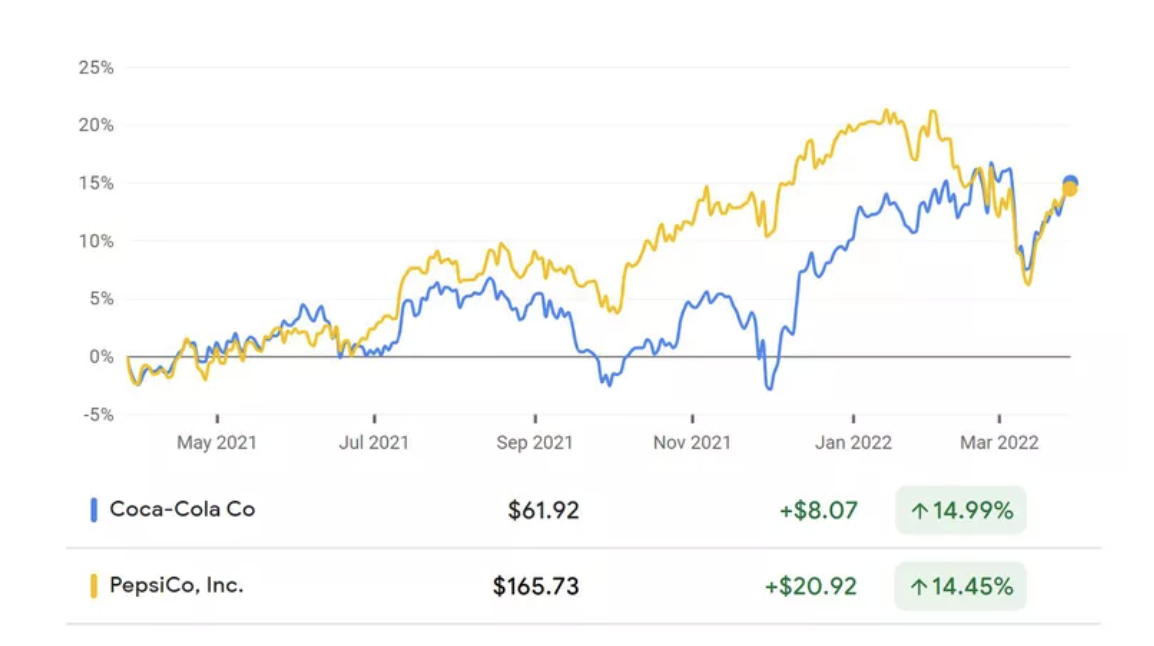
Nevertheless, even when economies of scale are realized, the bottlers need significant capital investments to launch the business, which raises the fixed price per unit. Through the first quarter of 2012, PepsiCo and Coca-Cola, Inc.’s shares increased by about 14.5%. PepsiCo had a market valuation of $229.3 billion, whereas Coca-was Cola’s was $268.4 billion (see Figure 1).

Comparing Profitability: Concentrate Business vs. Bottling Business
Key Expenses for Concentrate Producers: Marketing, Promotion, and Support
The most significant expenses for concentrate producers are marketing, promotion, market research, and bottler assistance programs. Nevertheless, the bottler’s most significant expenses are syrups, concentrates, and packaging. Whereas bottlers have substantial overhead expenses, concentrate producers have lower overhead costs. The labor cost for concentrate producers is now lower than ever, but the price for bottlers is much greater. If the concentrate producers can achieve economies of scale, the decreased labor and overhead costs impact their bottom line positively.
Comparing Operating Income: Bottlers vs. Concentrate Producers
Comparing concentrate producers’ profitability to bottlers’, there is a difference. Via an anticipated income statement, it can be inferred that the net sales per case are $0.98 for the concentrate makers and for bottlers is $4.63 (Yoffie & Kim, 2010, p. 16). The bottom-line percentage for bottlers will be more significant than concentrate producers, which may be inferred from this top line. Operating income for the bottlers is $0.36, or 8% of net sales (Yoffie & Kim, 2010). On the other hand, the operating income for concentrate producers works out to $0.30 per dollar case or 32% of the case’s net sales (Yoffie & Kim, 2010). The concentrate producers have lower general and administrative costs, lower direct marketing costs because their customers are more specialized and therefore do not require selling and delivery services, and lower price of items sold.
References
Maverick, J. B. (2022). Much of the Global Beverage Industry Is Controlled by Coca-Cola and Pepsi. Investopedia. Web.
Yoffie, D. B., & Kim, R. (2010). Cola Wars Continue: Coke and Pepsi in 2010. 711(462), 1–22. Web.