Network Diagram
Strengths
In context of the studies conducted by Hinze (2004, p.23), the network diagram, which was used as a resources and activity scheduling tool, had a number of strengths and weaknesses.
This method allowed for the use of activity precedence data to generate the network diagram to solve the resource and activity scheduling problems at each phase of the logo design process.
It was possible to accurately generate inordinate number of dummies for the logo design activities which consumed minimum computer resources, which did not require significant amount of computer experience.
The method was used to solve the problem of limited time and other resources, and was deemed appropriate for practically designing the logo (Kumar 2005).
The technique allowed for comprehensive multi-objective optimisation, making it less difficult to calculate information on each network and allowed for reduced late graphics editing time.
The method allows users with little knowledge on network design to understand and develop the network diagrams because activities are represented on arrows with particular lengths (Liu & Li 2007).
The diagrams allow the designer to comprehend the relative translation between activities and allows for the use of dummy activities to ensure that network logic is created appropriately.
The method allows for the establishment of different relationships between the logo design activities within the network diagram.
Weaknesses
The weakness experienced with this method was that it made it difficult for the designer to construct the initial network diagram at the initial stages of the process design to ensure that the intended design logic was maintained.
The required logic included creating sequence diagrams of identifying, differentiating, unifying, explaining, and anthropomorphizing the logo.
Insight gained
The insight gained when using the network design tools to schedule time and resources was that the resources such as time and money can be assigned appropriately depending on the need and time requirements, and if limited, the management can successfully schedule the resources.
To achieve the required network logic, it was possible to include dummy activities into the network diagram to allow for the management time and resources (Fengsheng 2005).
It is possible for the management to identify the correct method of assigning resources, and organising project tasks according to required project deliverables and the risks involved in the project lifecycle.
It is also possible to simulate the portfolio environment to asses and mitigate the effect of risks. In addition, it is possible to use the network diagram to crash activities when the project is facing time constraints.
Gantt
The Gantt chart project management tool was useful in enabling the scheduling of resources that were used in the logo design process, but had strengths and weaknesses, which are discussed in the following sections.
Strengths
The project tool allowed for effective project planning and provided for clear presentation and organisation of the project phases, ideas, and visualisation of project costs and the appropriate areas of cost reduction (Slack, Chambers & Johnston 2010).
It allowed for the elimination of redundant elements and ideas, and provided the ability for the each activity to be scheduled and executed on time and within the available resources. It was possible to effectively measure project objectives and evaluate the successful achievement of the objectives (Maylor 2001).
The tool provided the flexibility to increase productivity, encouraged simulation of the project processes, and provided the opportunity to understand different aspects of the project implementation process (Slack, Chambers & Johnston 2010).
Weaknesses
The weaknesses with the tool in the logo design process were that it limited the ability to visualize dependencies clearly and required one to be keen to avoid introducing any changes to the project development process, which could cause major changes in the entire project process (Slack, Chambers & Johnston 2010).
Insight gained
It is possible measure project success in terms of time, quality, and cost. In addition to that, the tool allows users to understand project activities clearly and effectively establish task dependencies.
Recommendations
The project tools used above provided satisfactory capabilities for allocating resources, but had weaknesses that could be addressed by the use of other project management tools such as computer assisted project management tools (Slack, Chambers & Johnston 2010).
Computer assisted tools provide an effective environment for simulating the project planning and control activities using project modelling techniques (Slack, Chambers & Johnston 2010).
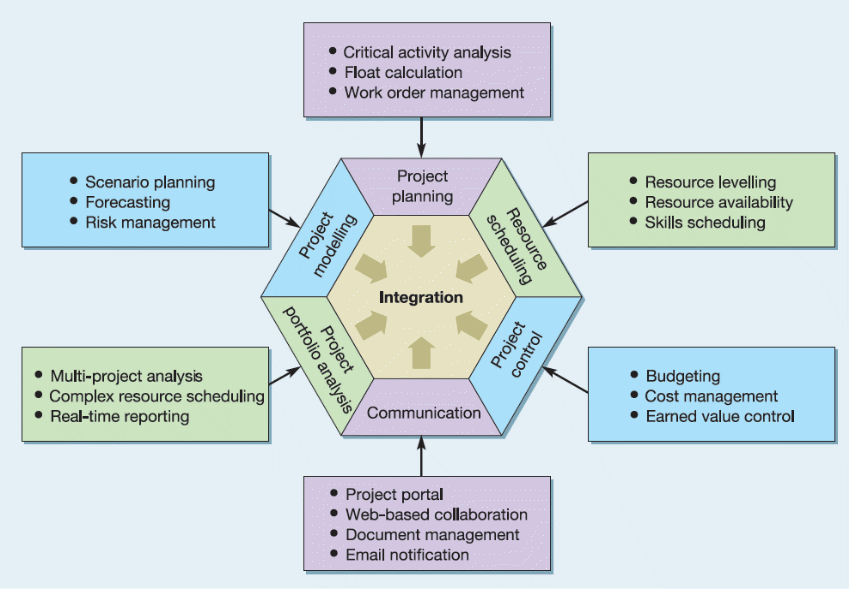
One advantage with the use of the tools is that some of the elements in project scheduling are integrated into the Enterprise Project Management (EPM) systems as shown in the diagram below.

(Source: Slack, Chambers & Johnston 2010, p. 490)
The diagram, above shows all the activities that are integrated into the software application and shows how each element forms part of the project implementation process.
According to Slack, Chambers and Johnston (2010, p.490), the application enables the user to enter the required data and perform calculations, analyse the relationship between activities, plan the project scenario, conduct resource levelling, and conduct the entire project analysis based on the elements of project implementation lifecycle, which include communication, control, portfolio management, resource scheduling, modelling, and project planning.
References
Hinze, JW 2004, Construction planning and scheduling. 2nd ed. Prentice Hall, Upper Saddle River, N.J.
Fengsheng, X 2005, ‘A New Algorithm for Finding the Critical Paths’, Computer Applications and Software, vol 6, no. 1, pp. 40
Kumar, PP 2005, ‘Effective Use of Gantt Chart for Managing Large Scale Projects’, Cost Engineering, vol 1, no. 1, pp. 47, 7.
Liu, X, & Li, C 2007, ‘Limited Resources Project Management’, Research Based on Critical Paths, vol, 1, no.1, pp. 34
Maylor, H 2001, ‘Beyond the Gantt Chart’ Project Management Moving on European Management Journal vol 19, no 1, pp. 39
O’Brien, JJ & Plotnick, FL 2006, CPM in construction management, McGraw-Hill, New York
Slack, N, Chambers, S, & Johnston, R 2010, Operations Management, Prentice Hall, New York