Introduction
Ensuring that items are supplied and consumers are satisfied critical; therefore, supply chain management uses demand planning to estimate or predict product demand. Every organization strives to strike a delicate balance between having enough inventory to fulfill client demand and avoiding overstocking. Labor force adjustments, economic transformations, extreme weather and natural catastrophes, and global crisis events all have the potential to alter demand. There are three key areas of demand planning: trade promotion management, statistical forecasting and product portfolio Management. Product portfolio management is a critical element that manages the whole product lifespan, from introducing a new product to its decommissioning.
Analysis
The research study focuses on employees of both private and public institutions who were asked about the advantages and the role of demand planning in their place of work. The study comprised nine respondents to fill in their names, start time, completion time, email and place of work. The comparison engaged the use of bar graphs and pie charts to represent the respondents’ opinions. The data is then divided into quantitative, where the conclusion is derived from the graphs and pie charts. Additionally, quantitative data analysis ensures a test for correlation using the correlation coefficient and Chi-Square test. Since the data is both quantitative and qualitative, a good conclusion can be made qualitatively and quantitatively. The report is divided into two types of data and is discussed broadly. The data discussion also contains discussions from other referenced sources that have similar findings from the data. The report will comprise qualitative data, quantitative data, discussions and a conclusion.
Qualitative Results
Qualitative data refers to data that can be observed or recorded to describe qualities or characteristics/ attributes. Often, this data is presented in a narrative after it has been gathered via surveys, interviews, or direct observation (Faria-Schützer et al., 2021). Analyzing qualitative data revolves around collecting and identifying patterns and themes that help answer a given research question.

The data from Figure 1 above shows that the number of respondents was twelve. Without clarifying gender, the chart shows the sector in which each respondent is employed. Four employees are employed in the public sector and eight in the private sector. This depiction shows that the data was derived from ideas from both public and private employees. Additionally, the private employees are many compared to those in the public sector. This situation explains why work in the public sector is less flexible than in the private sector.
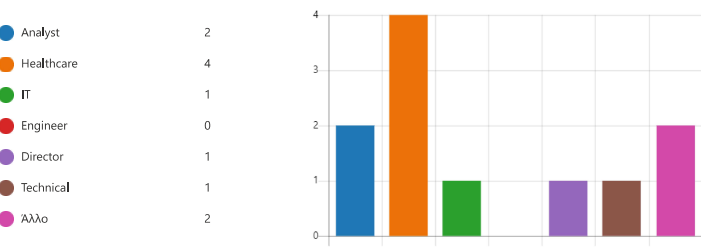
The data shown in figure 2 above displays the respective job title of the respondents, regardless of the industry in which they operate. There were two healthcare professionals, one information technology expert, and unfortunately, no engineers, while a director and technician were present. It is vital to notice from the preceding that the respondents had the best ability to get the correct judgments. As a result, the questionnaire was not filled out by anybody who had the intellectual ability to grasp what was going on and the prerequisites for the questionnaire. As a result, prejudice was decreased, and the necessary discussions were held promptly with no mistakes or missing variables.

The data above reveals that the twelve people who provided their responses concluded that demand planning is important for the company and business. From the data, a mean of 4.25 out of five believes that demand planning is very important for the business. Therefore, the company or the business has to put so much effort into making demand planning work in their respective institutions. Demand planning helps companies achieve a proper balance between supply and demand to maximise profits and customer happiness (Pakurár et al., 2019). Since it requires cooperation throughout the entire firm, this isn’t a simple task. There are, however, risks of substantial repercussions for the firm. For instance, when the working capital is locked up, inventory expenses are increased; thus, one may end up with low-value or outdated products in case of a huge inventory. When a company’s supply chain is disrupted due to inadequate planning, it might cause backorders, stockouts, or expensive scrambling for raw supplies. Delays may be caused by any of these problems, leading to disgruntled clients.

The data from Figure 4 above shows that a mean of 3.92 over five believe that demand planning helps in good company decision-making. Demand planning may be handled by a separate group or incorporated into one of the departments described above and procurement or operations departments. The reason is that demand planning affects so many areas within a company. When demand planning is tightly related to sales, marketing and demand forecasting, it becomes more effective for the department (Choi, 2021). The underlying reason is that it aids in tracking, predicting and decision-making.

The data above shows a mean of 3.92 out of five in the number of interviewers who believe that planning help planners work more efficiently. The prevalence of demand planning tools helps companies forecast accurately. For example, data from suppliers and distributors may be pulled into company planning and analysis using software that connects to point-of-purchase data. In addition, Internet of Things (IoT) devices may enhance demand planning by enabling enterprises to obtain real-time reports on the status of raw materials and inventories (Vithitsoontorn & Chongstitvatana, 2022). An IoT-enabled firm can immediately restock storefronts or warehouses that are selling out quicker than projected, thanks to real-time sales monitoring.

From the data above, 3.5 out of five believe that demand planning has an effect and can predict unexpected events. Demand planning has a very high effect on future prediction and can be used to forecast the future of the company or business. The action is part of the wider demand planning process, which examines internal and external data to forecast sales. Some industries and products may need longer or shorter timeframes for projections than others. Therefore, companies may revise their forecasts regularly in light of new information and changes in the market (Coba et al., 2018). To prepare for anticipated sales, a company must first know how much it will need to produce.

The above data shows that more than half of the respondents believe that the demand planning department should be a business or company department. Less than five percent disagreed with the question, and therefore the conclusion is that the department has more benefits to the company than losses. It is necessary to include and coordinate the efforts of many different departments to effectively perform the demand planning role (Song, 2022). Product portfolio managers and executives in charge of company strategy must also consider the lead times for components and manufacturing. Since demand planning affects so many aspects of a company’s operations, it is preferable to remain an autonomous unit rather than be folded into another department.
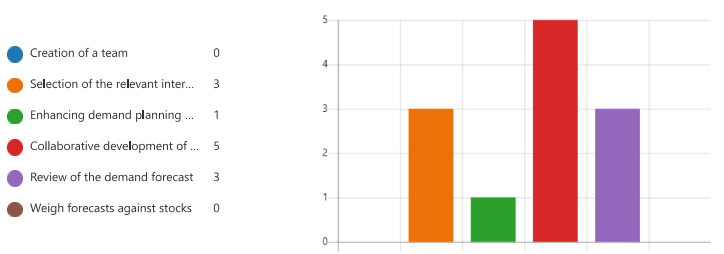
The data represented shows different stages of demand planning. In the first stage, no one agreed that creating a team is the most important stage; three people concluded that creating relevant internal data is the most important stage. Only one person suggested enhancing demand planning on external data as the most important stage. Five of the respondent agreed that collaborative development was the most important stage. Three people choose data to forecast and none on weight forecast against the stock (Alsem, 2019). Though all stages are important, the data shows that stage four is the most important according to the respondents.

Three people suggested that well-function manufacturing is the most important limitation in demand planning from the data. Four respondents opted to focus on the planning, while five focused on interaction with the other departments (Hashemi & Shayeghi, 2020). Demand planning can’t predict what will happen in the future. There is no way to know with certainty which of many possible business situations will come to pass. It’s possible to make a prediction useless even if you have access to accurate facts.
Qualitative Data and Discussion
The research question under investigation was, What sector do you work in * How important do you believe that demand planning is for a compa Crosstabulation.
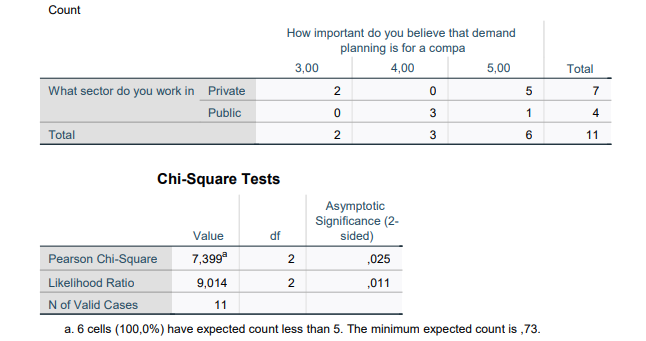
The data above aims to investigate cross-tabulation of demand planning using the chi-square test. The test shows a significant difference compared to the 0.05 level of significance with two degrees of freedom. Since the data significance of 0.025 is less than 0.05, we reject the hypothesis and conclude a significant difference between cross-tabulation and demand planning in the public and private sectors.
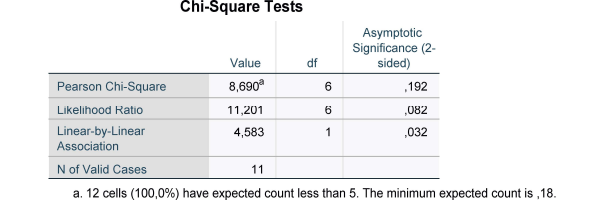
The data above show the cross tab of chi-square to reveal the relationship between demand planning and decision-making efficiency. The Pearson chi-square is 0.102, the likelihood ratio is 0.082, and the linear-by-linear association is 0.032. Using a significance level of 0.05 shows that 0.05 is less than 0.192; hence we accept the hypothesis of the existence of a relationship between demand planning and the efficiency of planners.
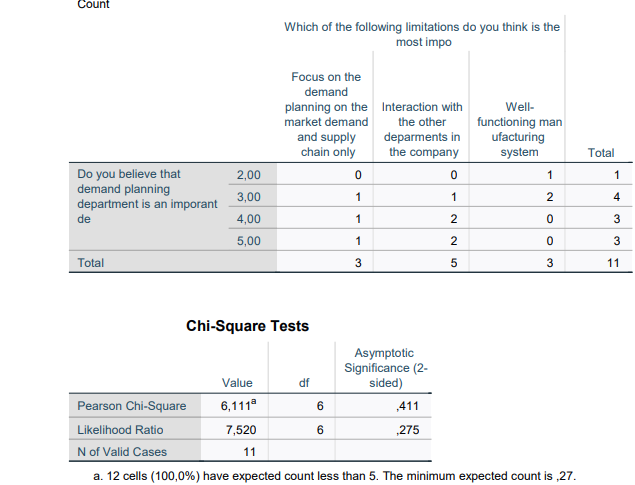
The above data focuses only on-demand planning based on market demand and supply. The data also shows the interaction with other departments and a well-functioning production system. According to the statistics, the eleven residents are divided into three groups, namely 3, 5, and 3. The Pearson likelihood is 0.411 in the chi-square table. This information is compared to a threshold of significance of 5%. Since 0.411 is less than 0.005, we may conclude that there is a high significance level and that demand planning is an essential business department.
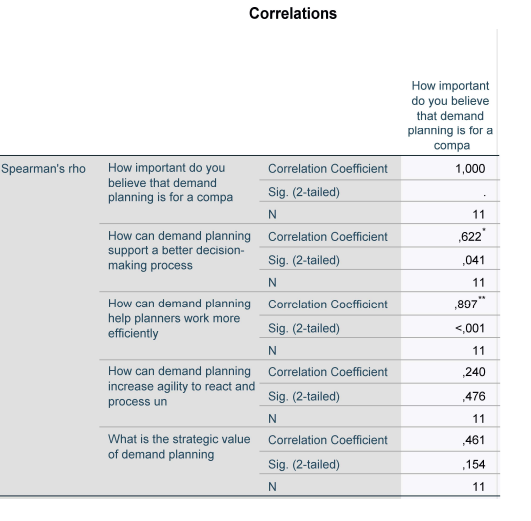
Correlation demonstrates the interdependence between different variables in a study. Correlation may indicate both a negative and a positive association based on the data shown. In the table, the correlations are 1,0.622, 0.857, 0.240, and 0.41. All correlations are positive, indicating a positive relationship between the variables. These results also demonstrate that the modification has a favorable effect. As a result, demand planning impacts decision-making, efficiency planning, and strategic value (Pollanen, Abdel-Maksoud, Elbanna and Mahama, 2016). This phenomenon is explained in the qualitative data, and the data will support the conclusion.
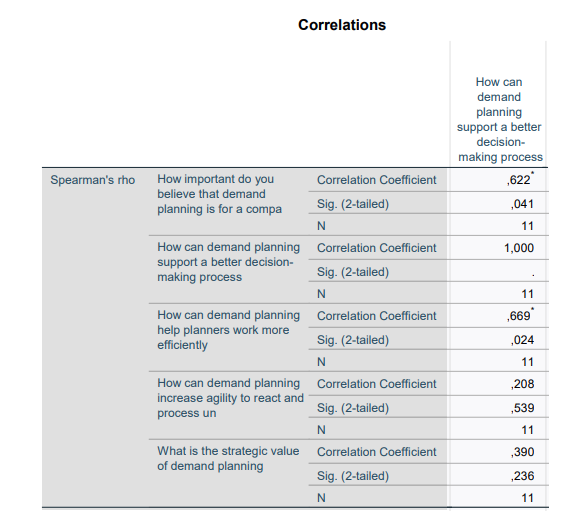
The correlation table depicts the relationship between demand planning and how it aids in better decision-making compared to demand planning. Demand planning aids in better decision-making, demand planning and efficiency. Demand planning increases the ability to react and process while deriving a strategic value (Priem, Wenzel and Koch, 2018). All of the correlation coefficients in the data above are positive, indicating that the variables have a positive relationship. The value indicated by a two-tailed test demonstrates a positive connection.
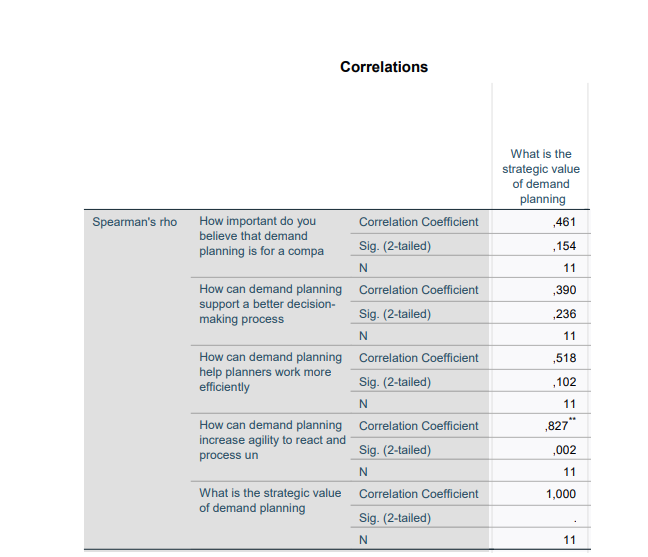
According to the statistics, the correlation of variables is positive. This situation demonstrates a positive relationship between the strategic value of demand and the other four values; 0.461, 0.390, 0.518, 0.827, and 1 are the coefficients. As seen in the conversation, this correlation reveals a unit change in the strategic value of demand planning’s influence on the other variables.
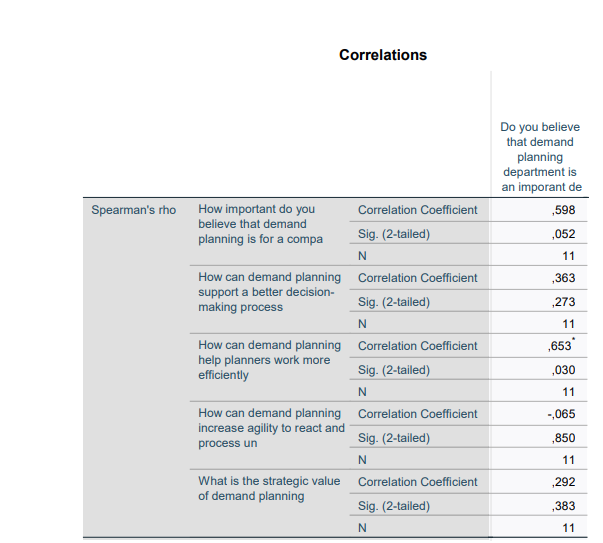
Regarding the importance of demand planning, it’s hard to say for sure. Demand planning has a correlation value of 0.558, better decision making has a correlation coefficient of 0.363, and greater efficiency has a correlation coefficient of 0.635. A negative correlation of -0.65 exists between the importance of demand planning and the ability to respond quickly, indicating that the two are intertwined. The correlation coefficient between the strategic value of demand planning and its monetary worth is 0.292.
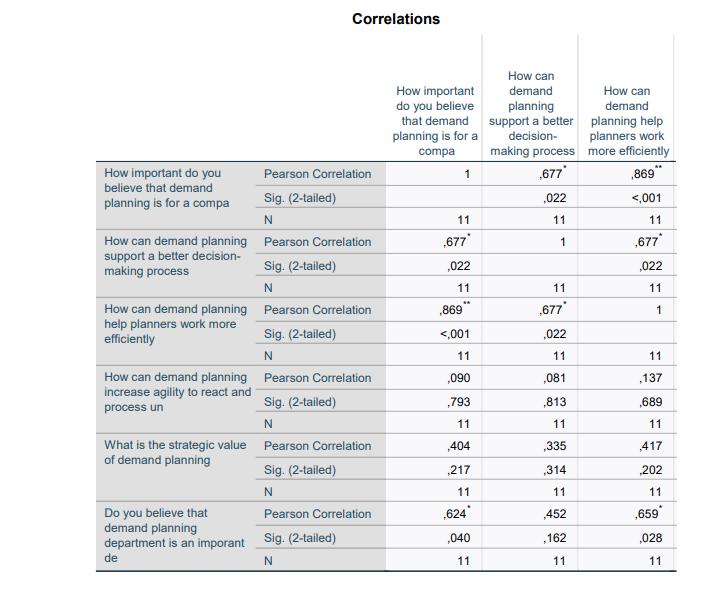
The above table shows the relationship of all the variables based on the coefficient. The Pearson correlation shows the relationship between the variables and their respective values, showing whether the correlation is negative or positive. From the data, it is clear that the correlation of all the variables is positive, meaning the respondent of the data meant that all four variables are related. A change in one variable positively leads to the other variable’s change.
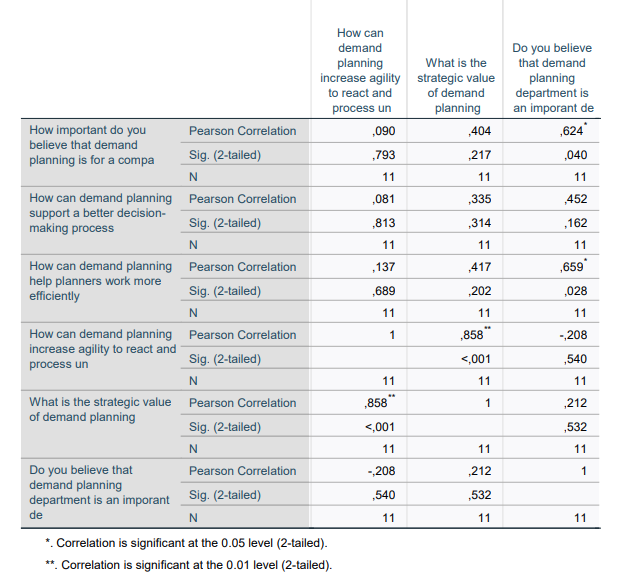
The table shows that instead of only utilizing one tail, the correlation of the variable is now calculated using two tails, with significance levels of 0.05 and 0.01 for each. In the two-tailed test, Pearson correlation coefficients larger than 0.05 and 0.01 are significant. There is a positive association between Pearson correlation coefficients and Pearson correlation values, whereas these two numbers have a negative correlation.
Conclusion
Demand planning is a critical practice in any business or organization. Demand planning supports most people who work in chain management, so it has a very significant stake in the success of a business or a corporation. This situation is contrasted to the public or private sectors, where there is much evidence of the relevance of demand planning. Demand planning helps planners operate more effectively; it increases the ability to respond and process and its strategic value in organizational planning. The revised data also indicates the correlation of the variables, allowing us to infer that demand planning has a positive relationship with all of the characteristics listed above.
References
Alsem, K., 2019. The strategic marketing planning process. Applied Strategic Marketing, 2(2), pp.21-48.
Choi, S., 2021. Single-Period Capacity and Demand Allocation Decision Making under Uncertainty.Decision Making [Working Title], Web.
Coba, L., Shimabuku, C. and González-Feliu, J., 2018. Improvement of the Demand Planning of Imported Seeds in the Company Agro Perú SA.Best Practices in Manufacturing Processes, [online] pp.261-281. Web.
Faria-Schützer, D., Surita, F., Alves, V., Bastos, R., Campos, C. and Turato, E., 2021. Seven steps for qualitative treatment in health research: the Clinical-Qualitative Content Analysis. Ciência & Saúde Coletiva, 26(1), pp.265-274.
Hashemi, Y. and Shayeghi, H., 2020. Demand Response Application in Generation, Transmission, and Distribution Expansion Planning. Demand Response Application in Smart Grids, pp.163-191.
Pakurár, M., Haddad, H., Nagy, J., Popp, J. and Oláh, J., 2019. The Service Quality Dimensions that Affect Customer Satisfaction in the Jordanian Banking Sector. Sustainability, 11(4), p.1113.
Priem, R., Wenzel, M. and Koch, J., 2018. Demand-side strategy and business models: Putting value creation for consumers center stage. Long Range Planning, 51(1), pp.22-31.
Song, S., 2022. Location-boundedness, investment irreversibility, and divestment of international joint ventures under host market demand uncertainty. Long Range Planning, 55(1), p.102073.
Vithitsoontorn, C. and Chongstitvatana, P., 2022. Demand Forecasting in Production Planning for Dairy Products Using Machine Learning and Statistical Method. 2022 International Electrical Engineering Congress (iEECON), Web.