Introduction
The aim of this paper is to analyse a community and to identify its problems. The community chosen is the state of Tasmania. Tasmania sits just 240 kilometers south-east of mainland Australia and represents only 0.9% Australia’s land area and supports around 3% of Australian population (ANRA, 2011). The paper will define the criteria of a community. Tasmanian profile is then discussed and its demography is analysed as well as mortality and morbidity and social data. The demographic and mortality and morbidity data of Tasmania will then be compared with similar data from New South Wales (NSW) in order to identify health issues. Three issues of health will later be identified and actions to combat the top priority problem will be discussed. Lastly, the health intervention will be outlined before the conclusion of the paper.
Community overview
Australian Bureau of Statistic (ABS), (2011) define both Tasmania and NSW as communities because they are made up of groups of people with diverse characteristics of culture, and socio-economic and regional background whilst sharing a sense of identity and belonging either by boundary, social links, location and while contributing to community social coherence.
According to Queensland Health (2007), Tasmania and NT can be classified as communities because it consists of a society living in the same place, having the same interests, values, privileges and are governed by the same laws.
Community profile
Demographic data
Population, sex and age
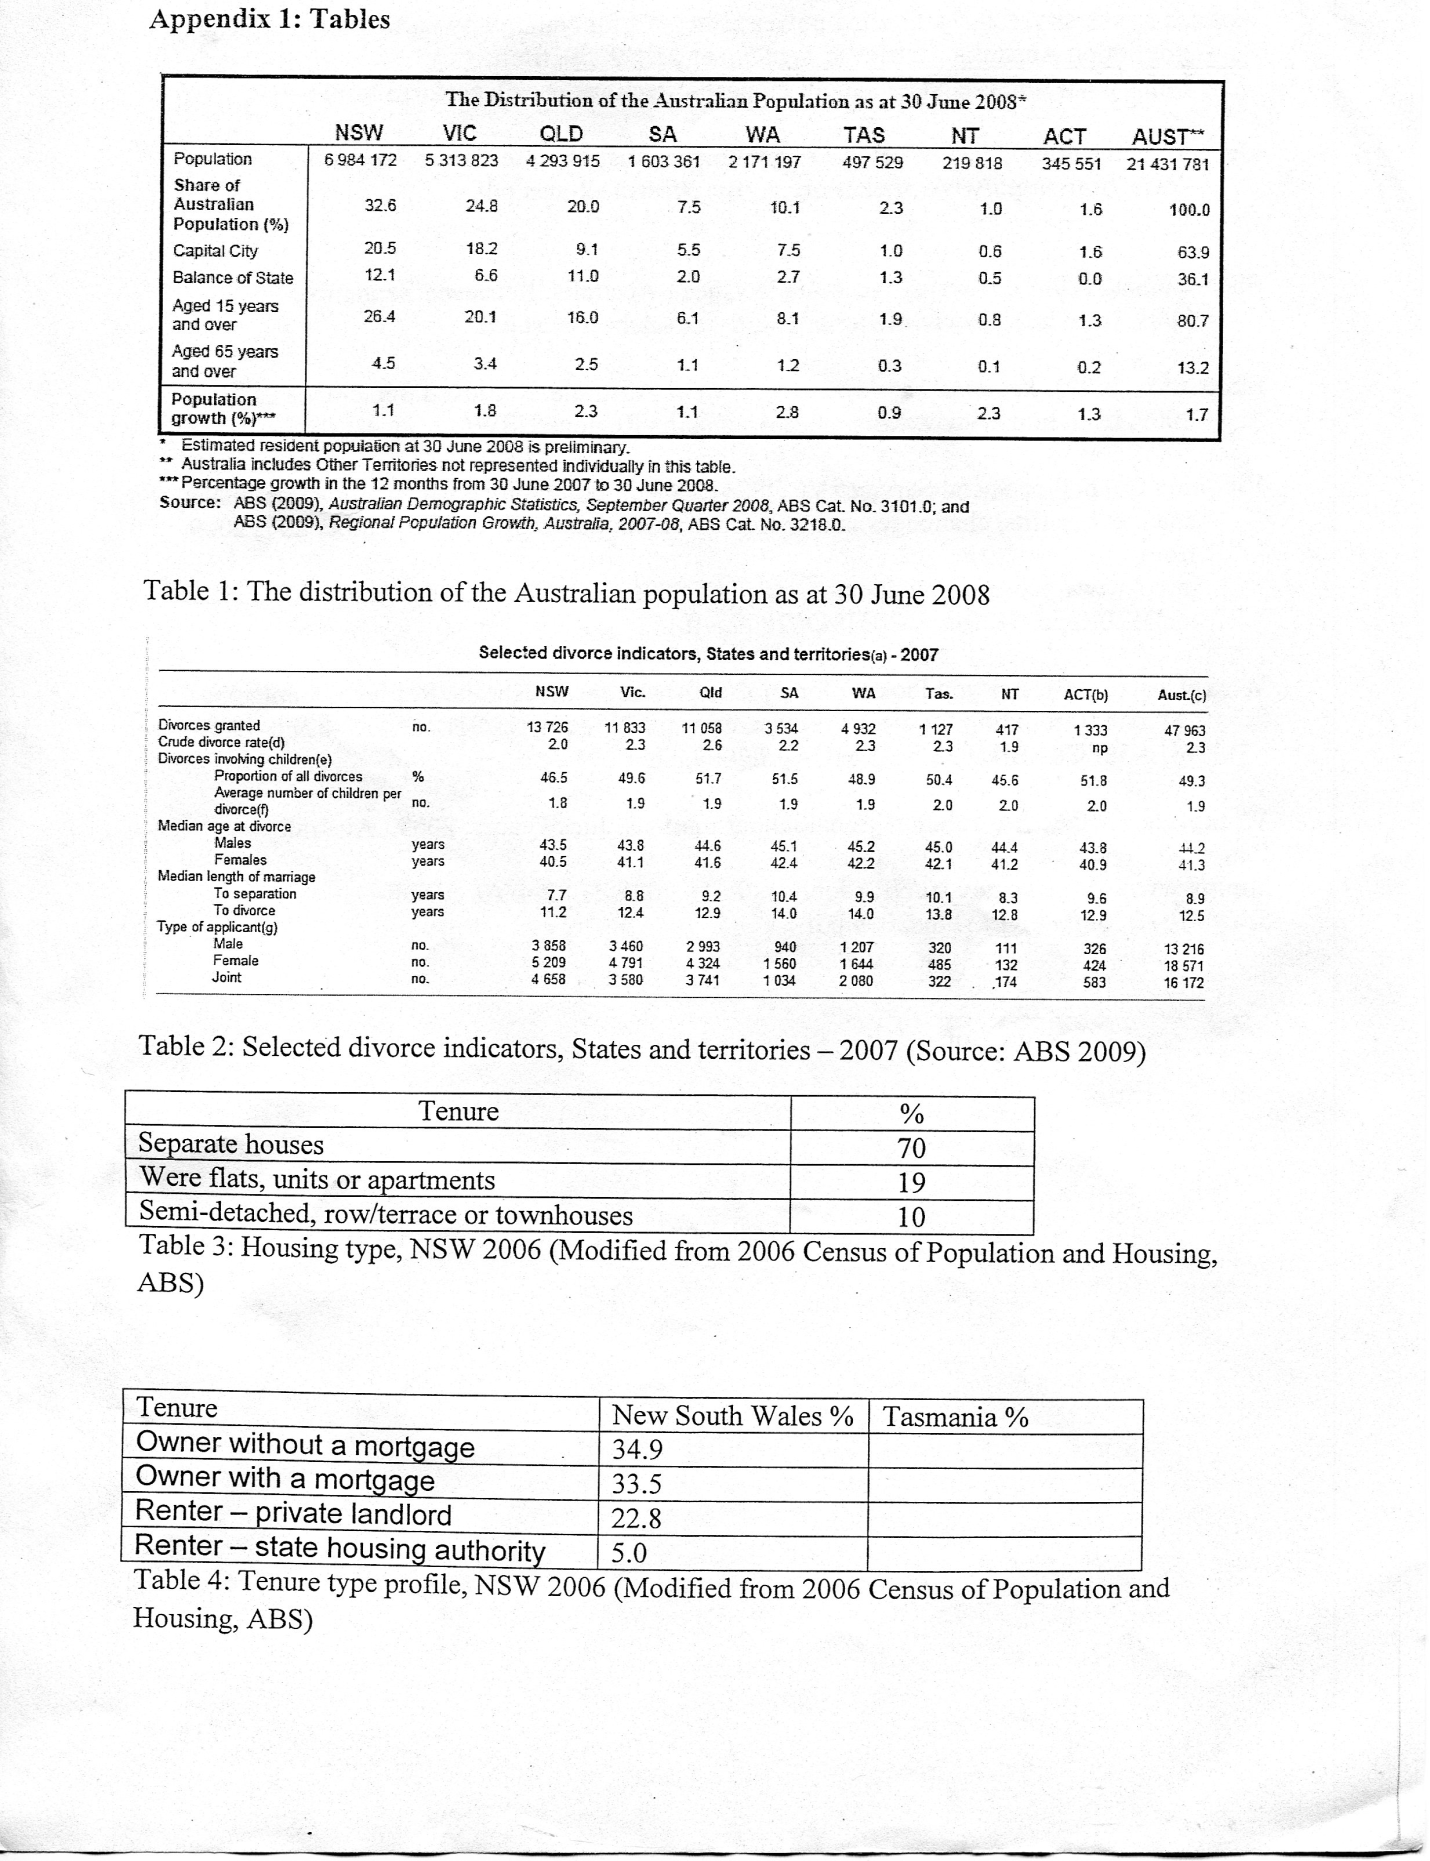
In June 2008, Tasmania’s total population was 497,500. Tasmania had the smallest population growth of 0.9 and was the oldest population in Australia with its median age of 39.4 years. Males represented 49.3% of the population and females 50.7% with a median age of 38.5 years and 40.3 years respectively. Also, 19.5% of total populations were less than 15 years. 65.5% of people are of working age (15-64 years) and 15% were aged 65 and over (ABS, 2011).
Racial distribution
In year 2006, 3.5% of populations are of indigenous origin, 10.6% were born over seas, mainly from UK and New Zealand, the rest being Australian citizens (ABS, 2007).
Family size
There were also 128, 660 families recorded in Tasmania in 2006. Of these, couples families with no children constituted 40.5% and with children were 41.4% and the rest were one parent families. Household average size was 2.5 persons per house (ABS, 2011).
Marital status
Median marriage age for males was 32.6 years in2007 and for females was 30 years. Crude marriage rate was 5.7% and crude divorce rate of 2.3 per 1,000 population with a median duration of marriage prior to divorce was 13.8 years (ABS, 2011).
Housing
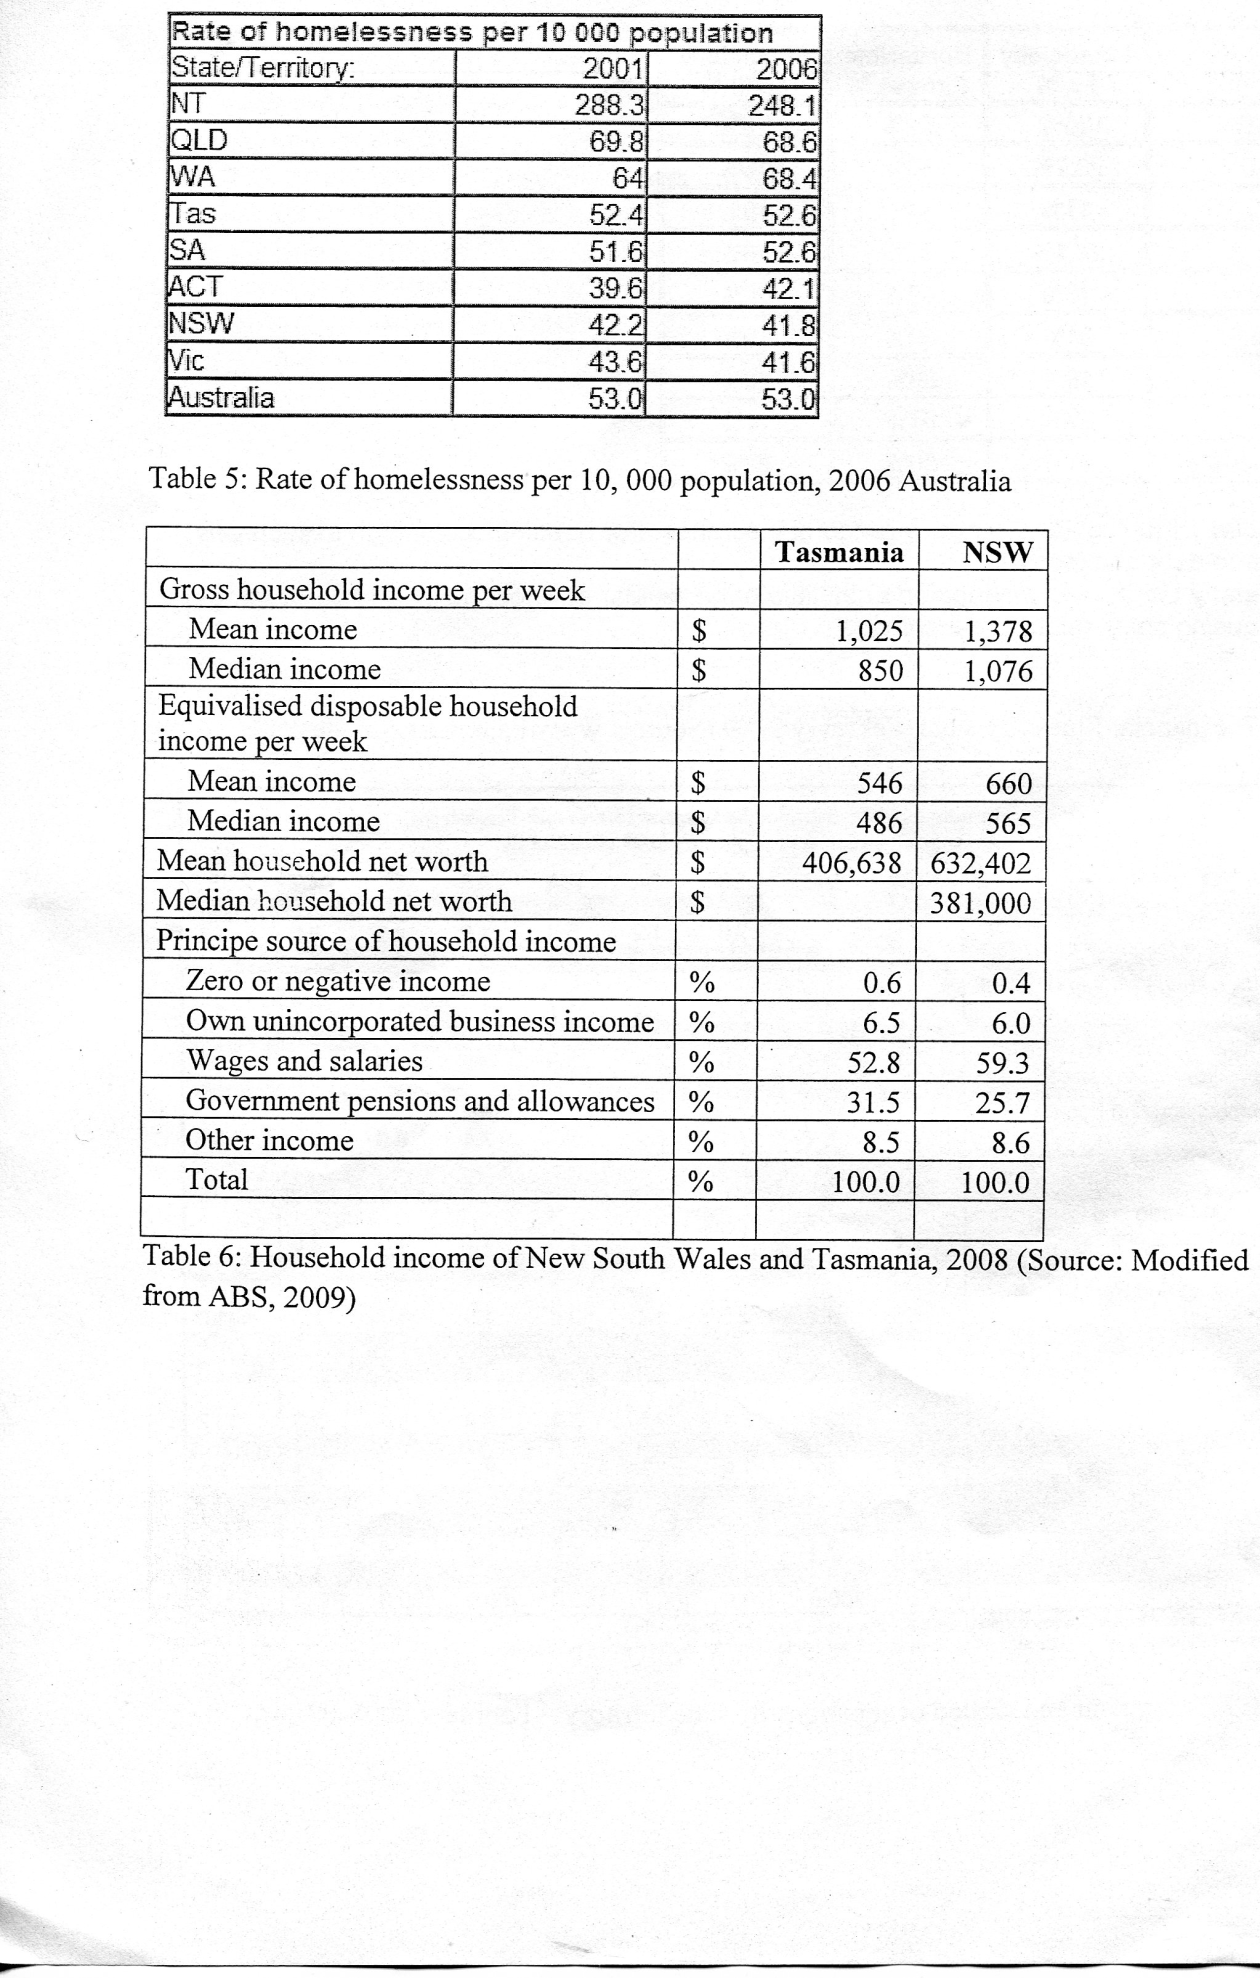
In 2006, there were 189,067 occupied private dwellings in Tasmania. Of these, 80% were separate houses, 8.6% were flats or apartments, and 4.2% were semi-detached or town houses with an average of three bedrooms, (ABS, 2011). The median monthly mortgage repayment was $867 and the median rent paid was $135. Tasmania’s rate of homelessness at 52.6 per 10,000 population and the majority of them were staying with friends or family (50%) or in crisis accommodation shelters (25%). 69% of the homeless population in Tasmania were aged below 34.31% were aged between 12-18 years 14% were 12 years or younger (shelter TAS, 2011).
Main reasons for homelessness in Tasmania are eviction/ previous accommodation ended (14.5%), usual accommodation unavailable (14%), domestic and family violence (13.5%) and relationship/ family breakdown (10%) (Shelter TAS, 2011).
Income
In 2008, the median earnings in Tasmania were $250 with wages being the main source of income followed by government pension. The average household net worth was 406,638 (ABS, 2011).
Occupation
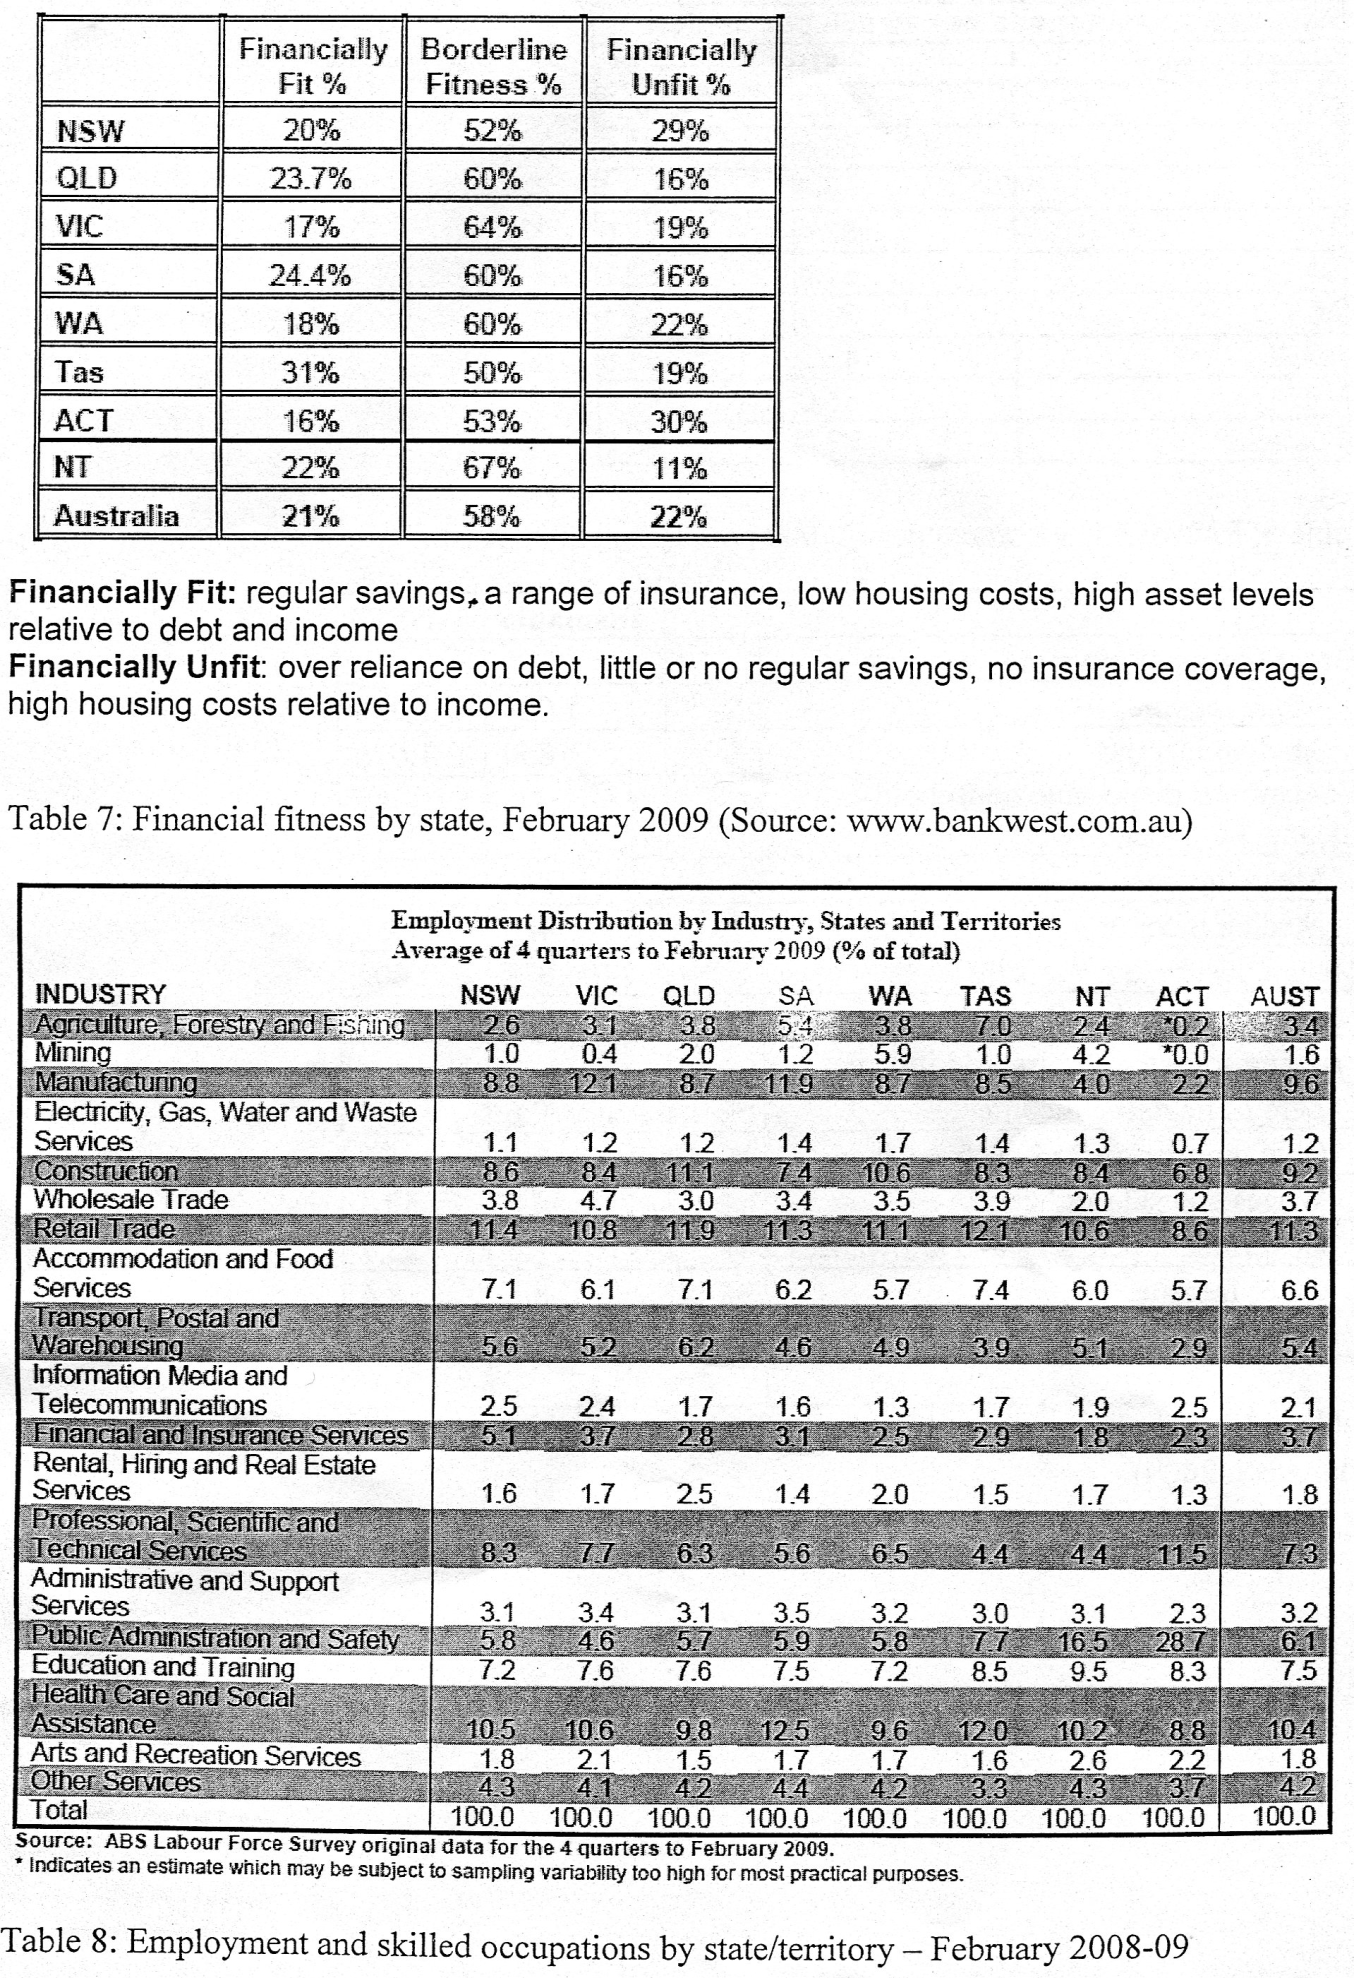
Referring to table 8, there are 328,800 working aged population and the majority of them are employed in health care and social assistance, retail trade manufacturing and education (ABS, 2011).
Unemployment
As at august 2011, Tasmania’s employment rate was 67.8% with 61%participatiopn rate and unemployment rate was 5.1% (Workplace, 2011).
Education
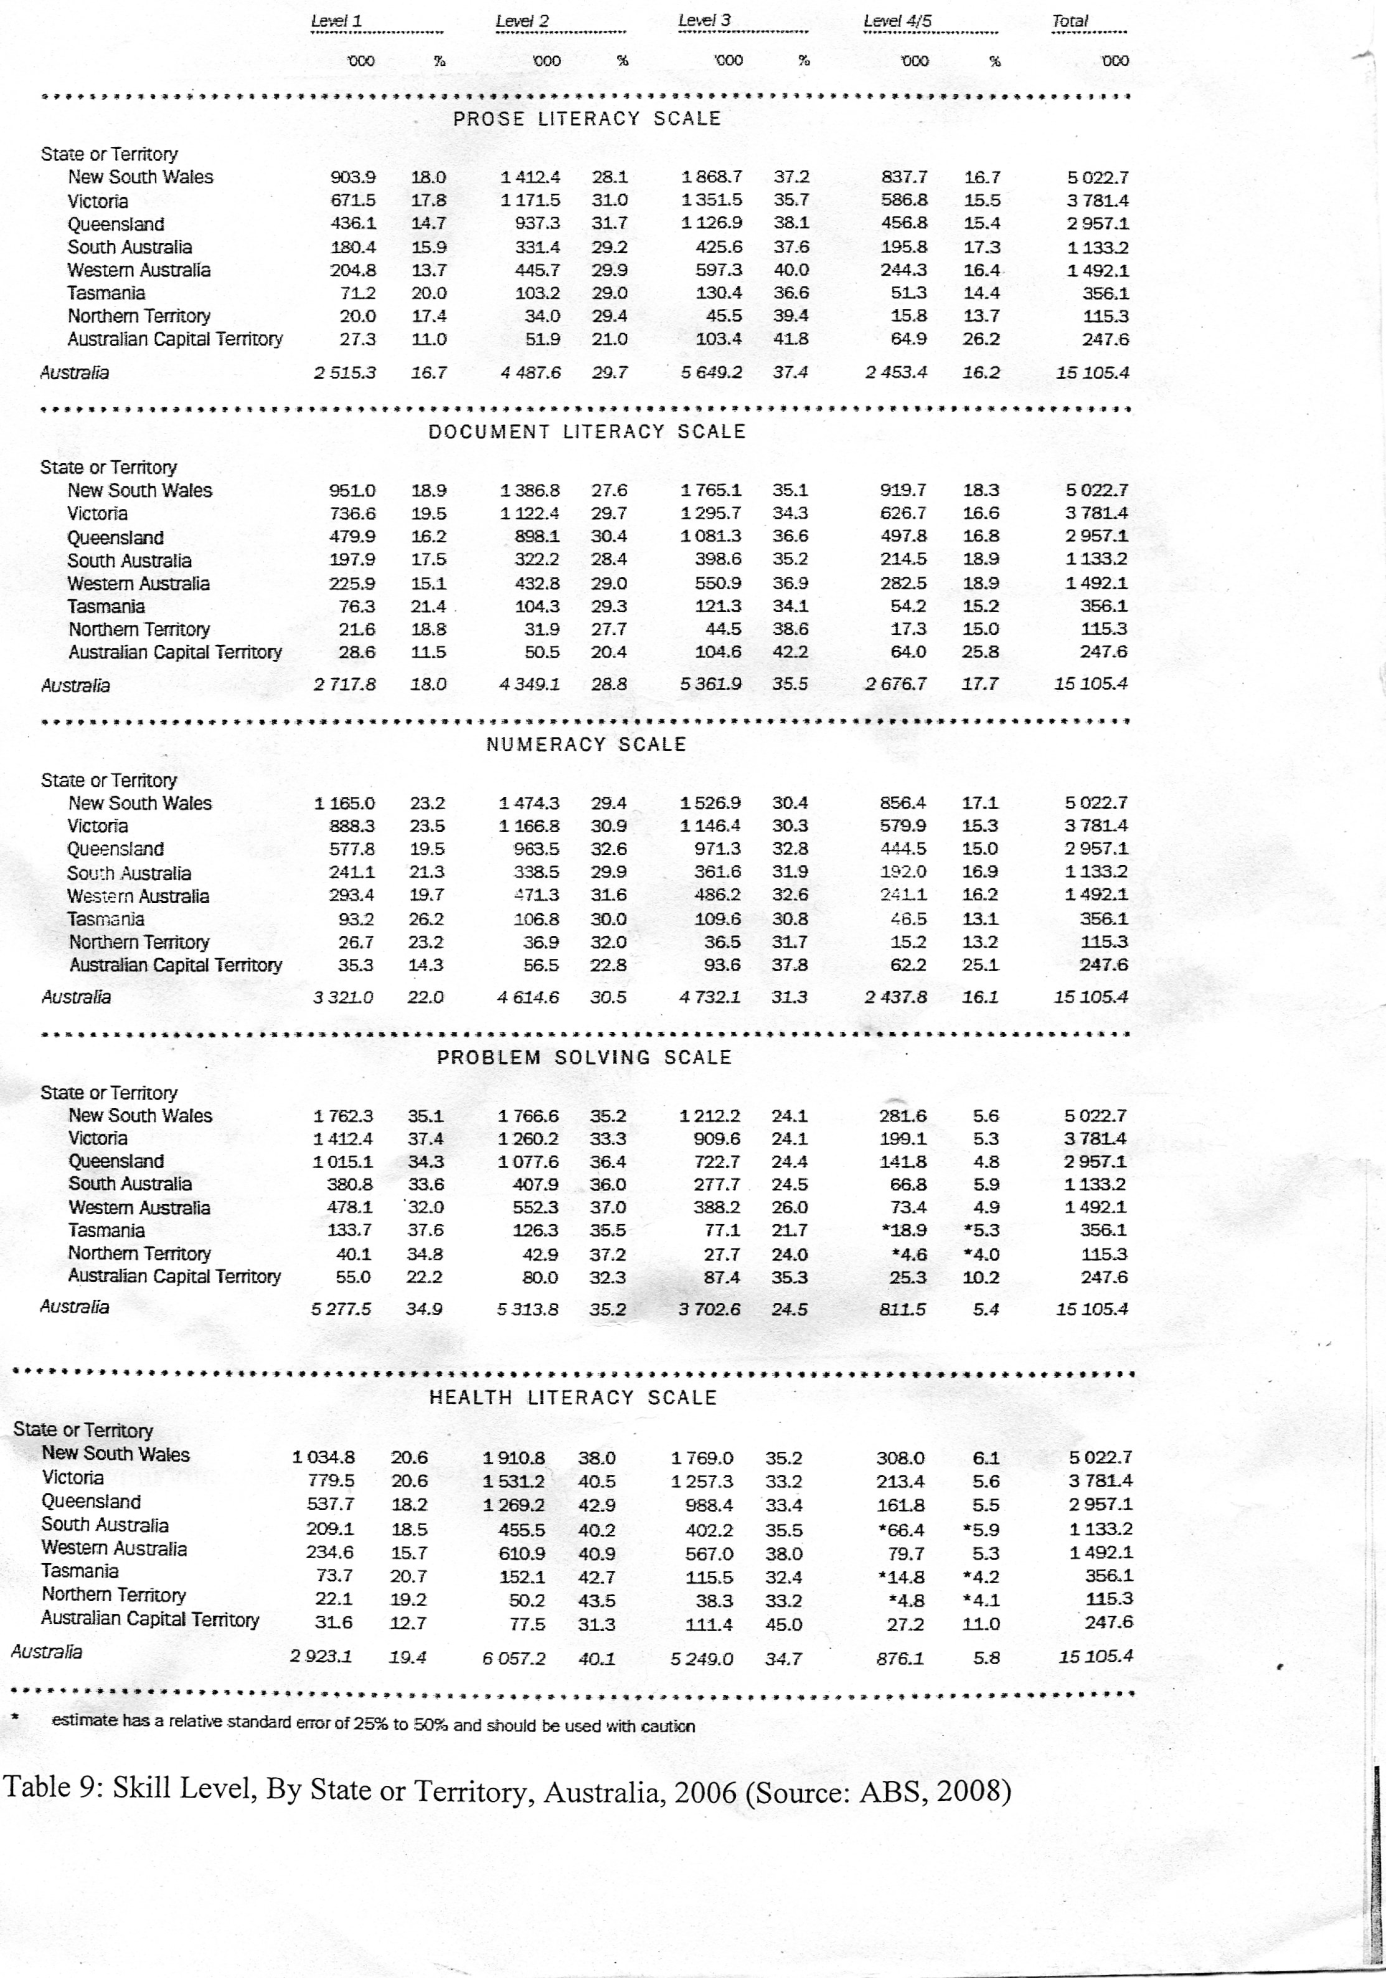
Table 9 shows that, Tasmania had the highest population of the 15-74 at level at each literacy scale. Due to low year 10 retention rate only 52% students completed year 12 resulting in only 47% of the work force has post school qualification (GOT, 2007).
Mortality and morbidity data
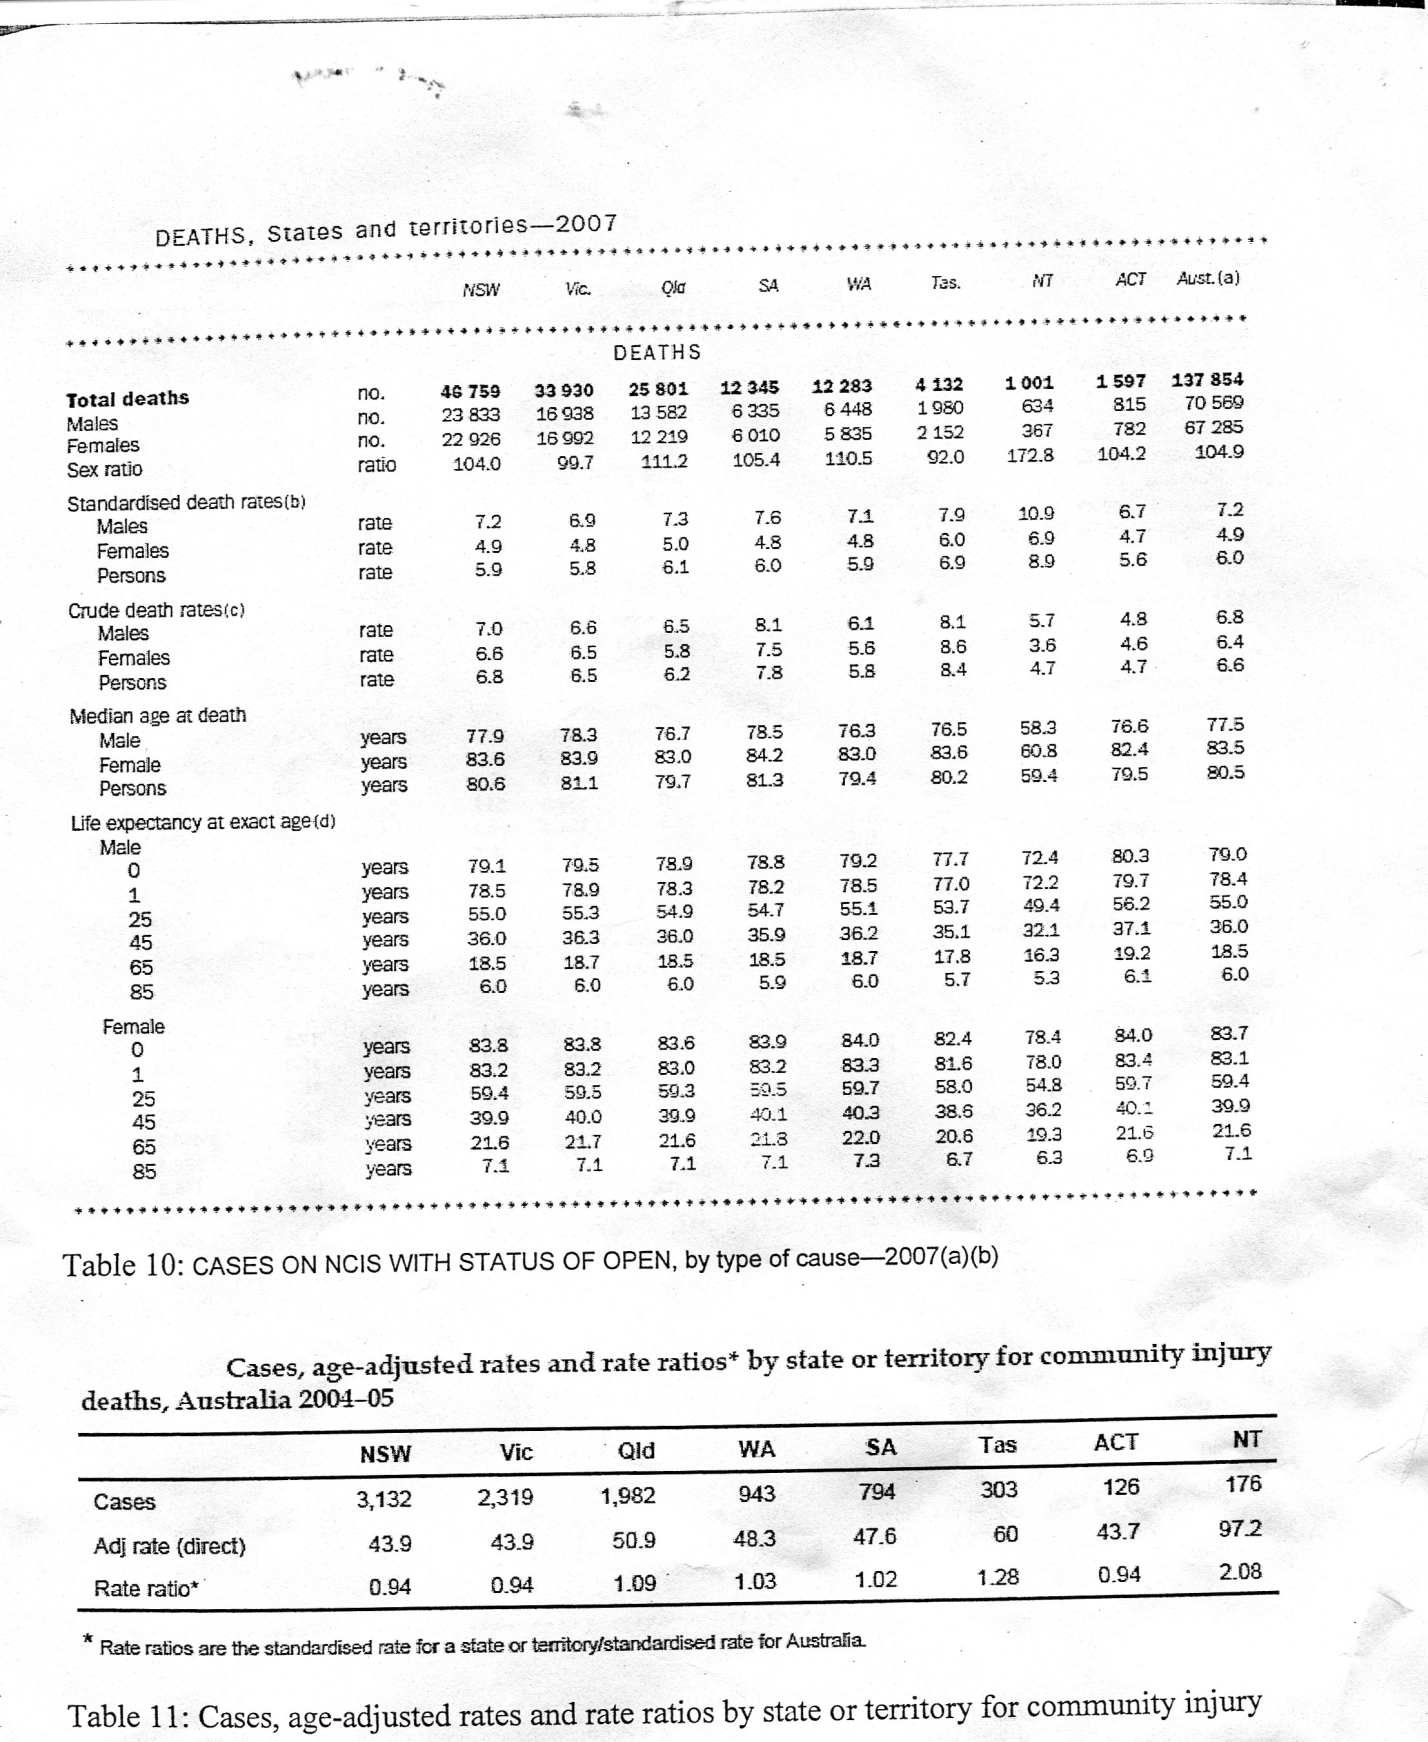
In 2006, male’s life expectancy in Tasmania was 77.4 years and female’s was 88.3 years. Tasmania standardized death rate (SDR) was 2.9 deaths per 1,000 population with males SDR higher than female’s, (table 10). In 2006 disease of the circulatory system accounted for over A 3RD (33.3%) and cancer accounted for 28.2% of all deaths in Tasmania (ABS, 2011)
Tasmania had the highest proportion of people (5.2%) with a need of assistance with self care, mobility or communication because of a long-term heath condition, disability or old age. Increased life expectancy for females reflects more than half (56.6%) needed assistance were females (AIHW, 2011).
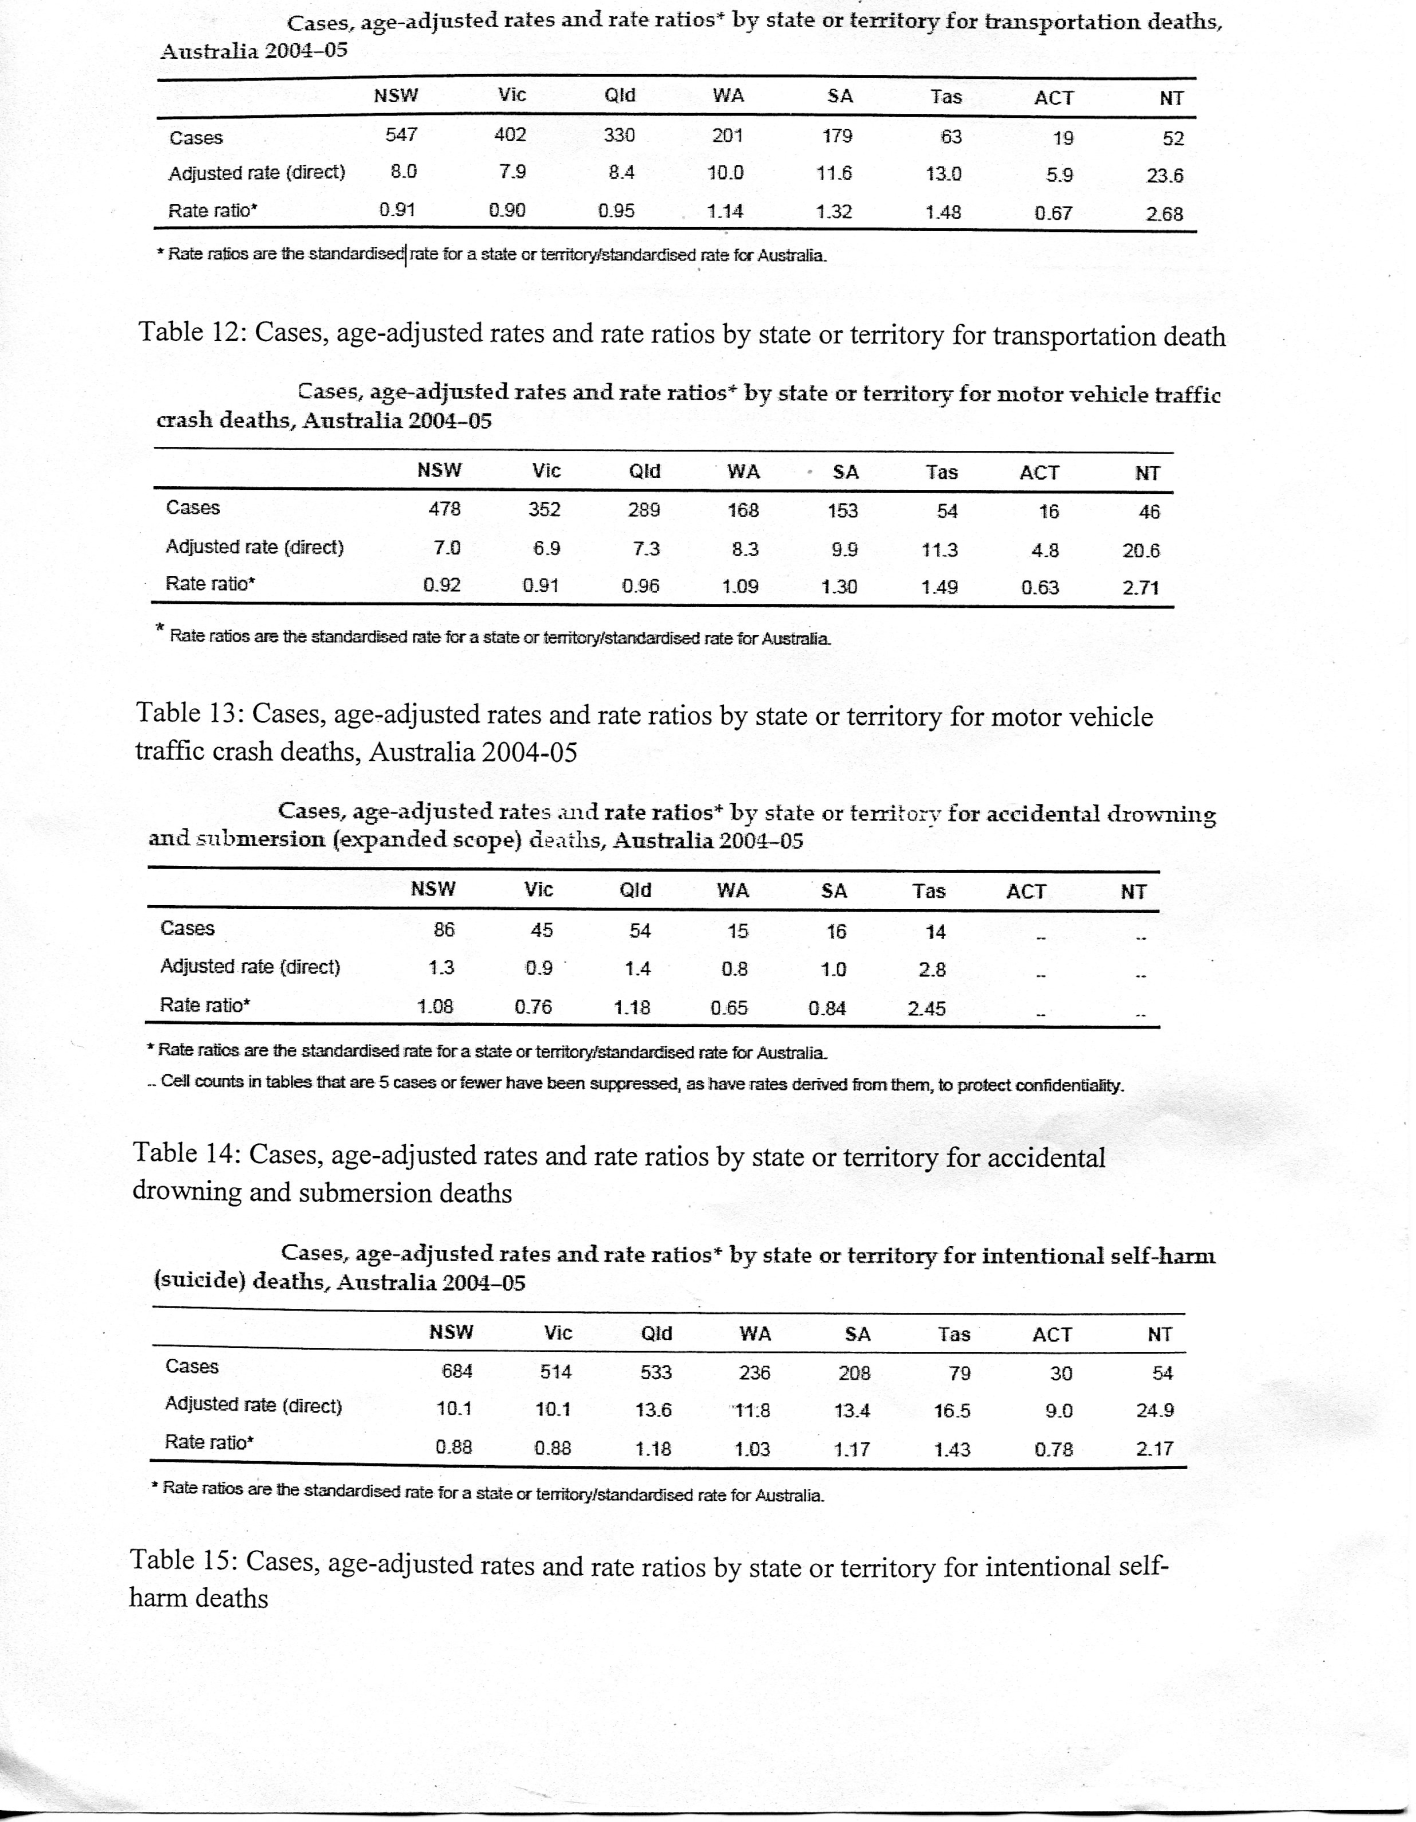
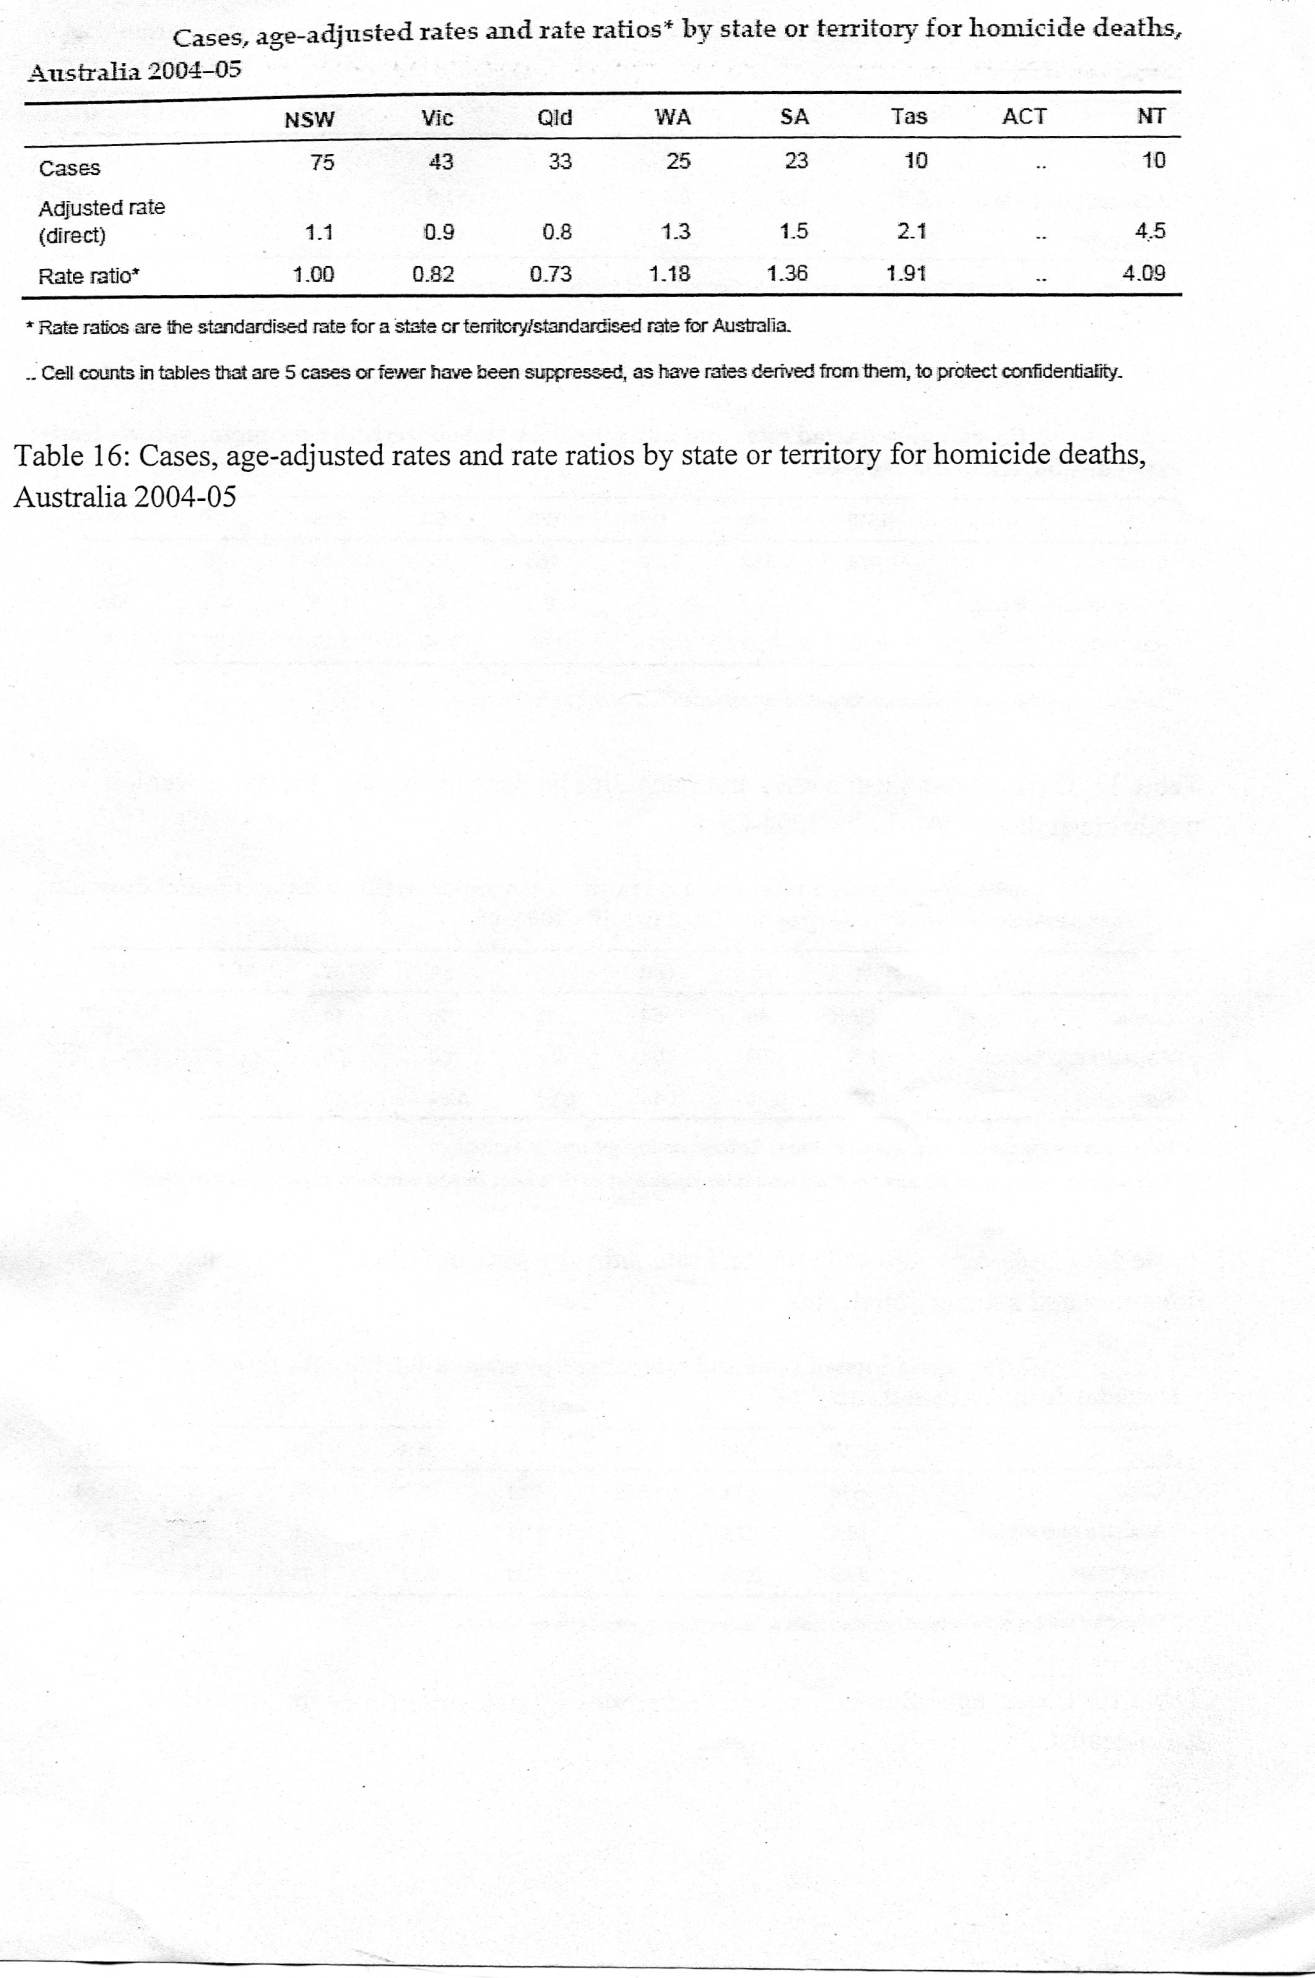
During 2004-5 Tasmania had the second highest (60 deaths per 100,000 population) community injury deaths occurred in Australia (AIHW, 2011). Tasmania’s transport related death rate of 13.0% was almost 50% higher than the national rate. Motor vehicle death rate of 11.3 was almost 50% higher than the national rate. Unintentional drowning injury was the highest in Australia of 2.8 deaths per 100,000 population. Self harm (suicide) injury rate of 16.5 was over 40% higher than the national rate of 11.5 deaths per 100,000 population. Intentional harm by another person injury was almost double the national rate of 1.1 per 100,000 population (ABS, 2008)
Health risk behaviors
Less than half of people aged 18 – 64 years and one third of those aged 65 years and over reported that they ate 1 or less serves of fruit per day. Around 70% of people aged 18 and over reported that they were sedentary or had low exercise levels and nearly 50% of Tasmanian populations have weight problems.
Social data
Unemployment
In March 2011, Tasmania had unemployment rate at 4.6% with a labor force participation rate of 62.1% (Shelter TAS, 2011).
Absenteeism
Figure 8 shows that absenteeism from work due to illness is greater in Tasmania tan in Australia as a whole. Tasmanians aged 25 to 30 having higher absenteeism compared to older worker may relate to factors other than disease and that older worker with age related chronic disease may have retired (DCAD, 2008.)
Population density
At June 2008, Tasmania’s population rate was 7 people per square kilometer compared to 2.8 in Australia. Tasmania’s population is more concentrated around the coastal area reflecting the retirement place for its ageing population (ABS, 2007).
Crime rates
For the 2007-08 periods, there were more than three times as many male offenders as female offenders. The median age for males was 25 years and 23 for female offenders. Males aged 19years offended at a rate three times higher than for all male offenders and female aged 17 years offended at five times higher than for all female offenders (ABS, 2011)
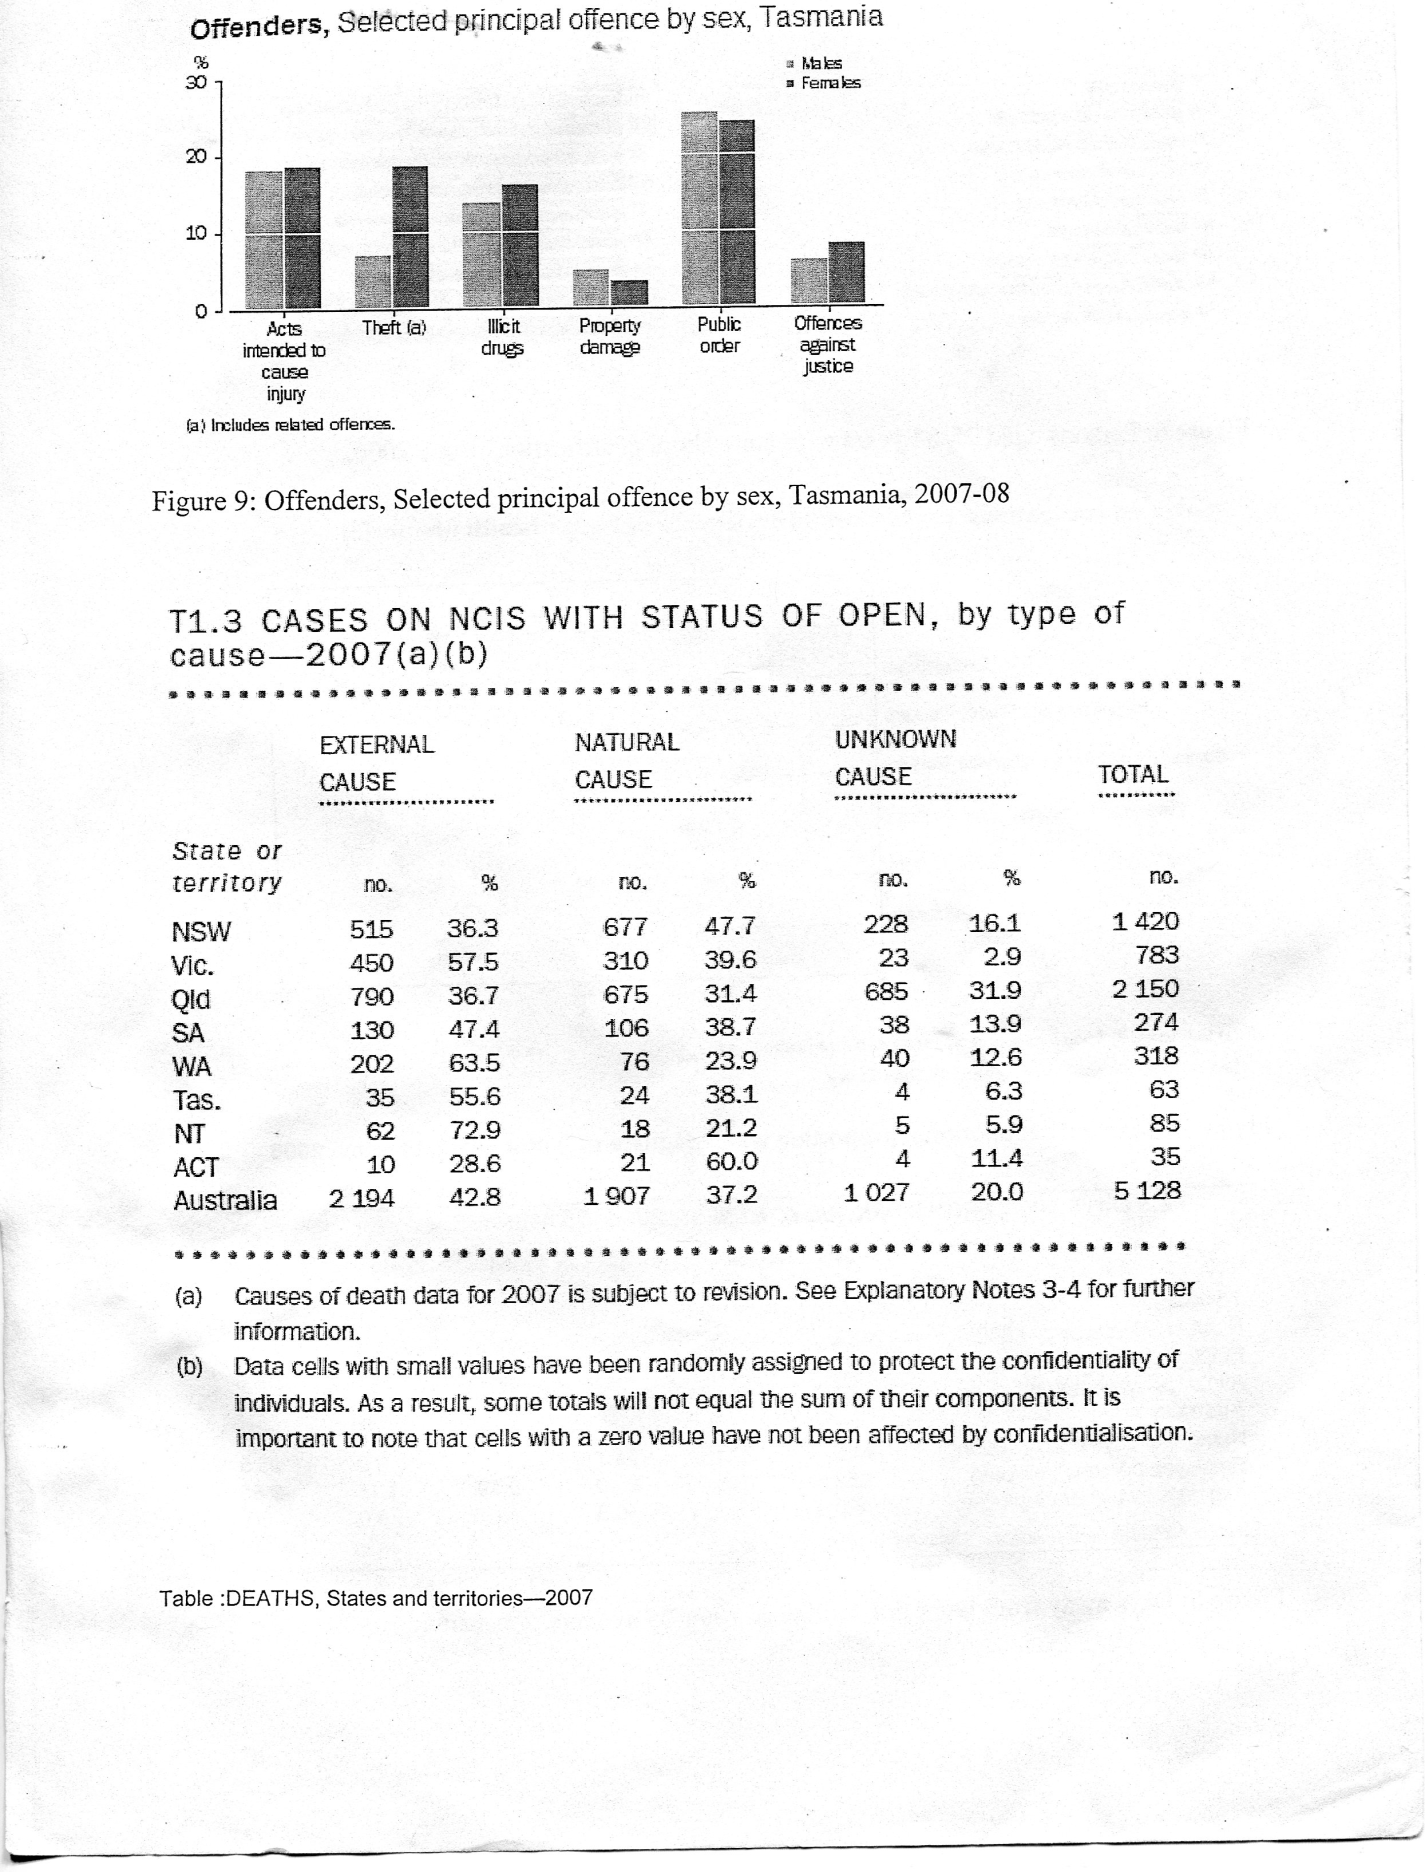
According to figure 9, the predominant principal offence was public order offences (25% of all offenders) with females taking the edge over male offender in theft, intended to cause injury and illicit drug offences (ABS, 2011).
Data analysis
Although NSW harbors one third of Australia’s population at 6.98 million people but according to table 1, Tasmania has a lower proportion of people working age and higher proportion of people aged 65 years and over. Also the lower proportion of people aged 20 to 44 years in Tasmania, many be related to outflow of young people from Tasmania to pursue employment opportunities interstate and the higher proportion of people aged 45 years and over is due to the trend of older adults moving to Tasmania (ABS, 2011).
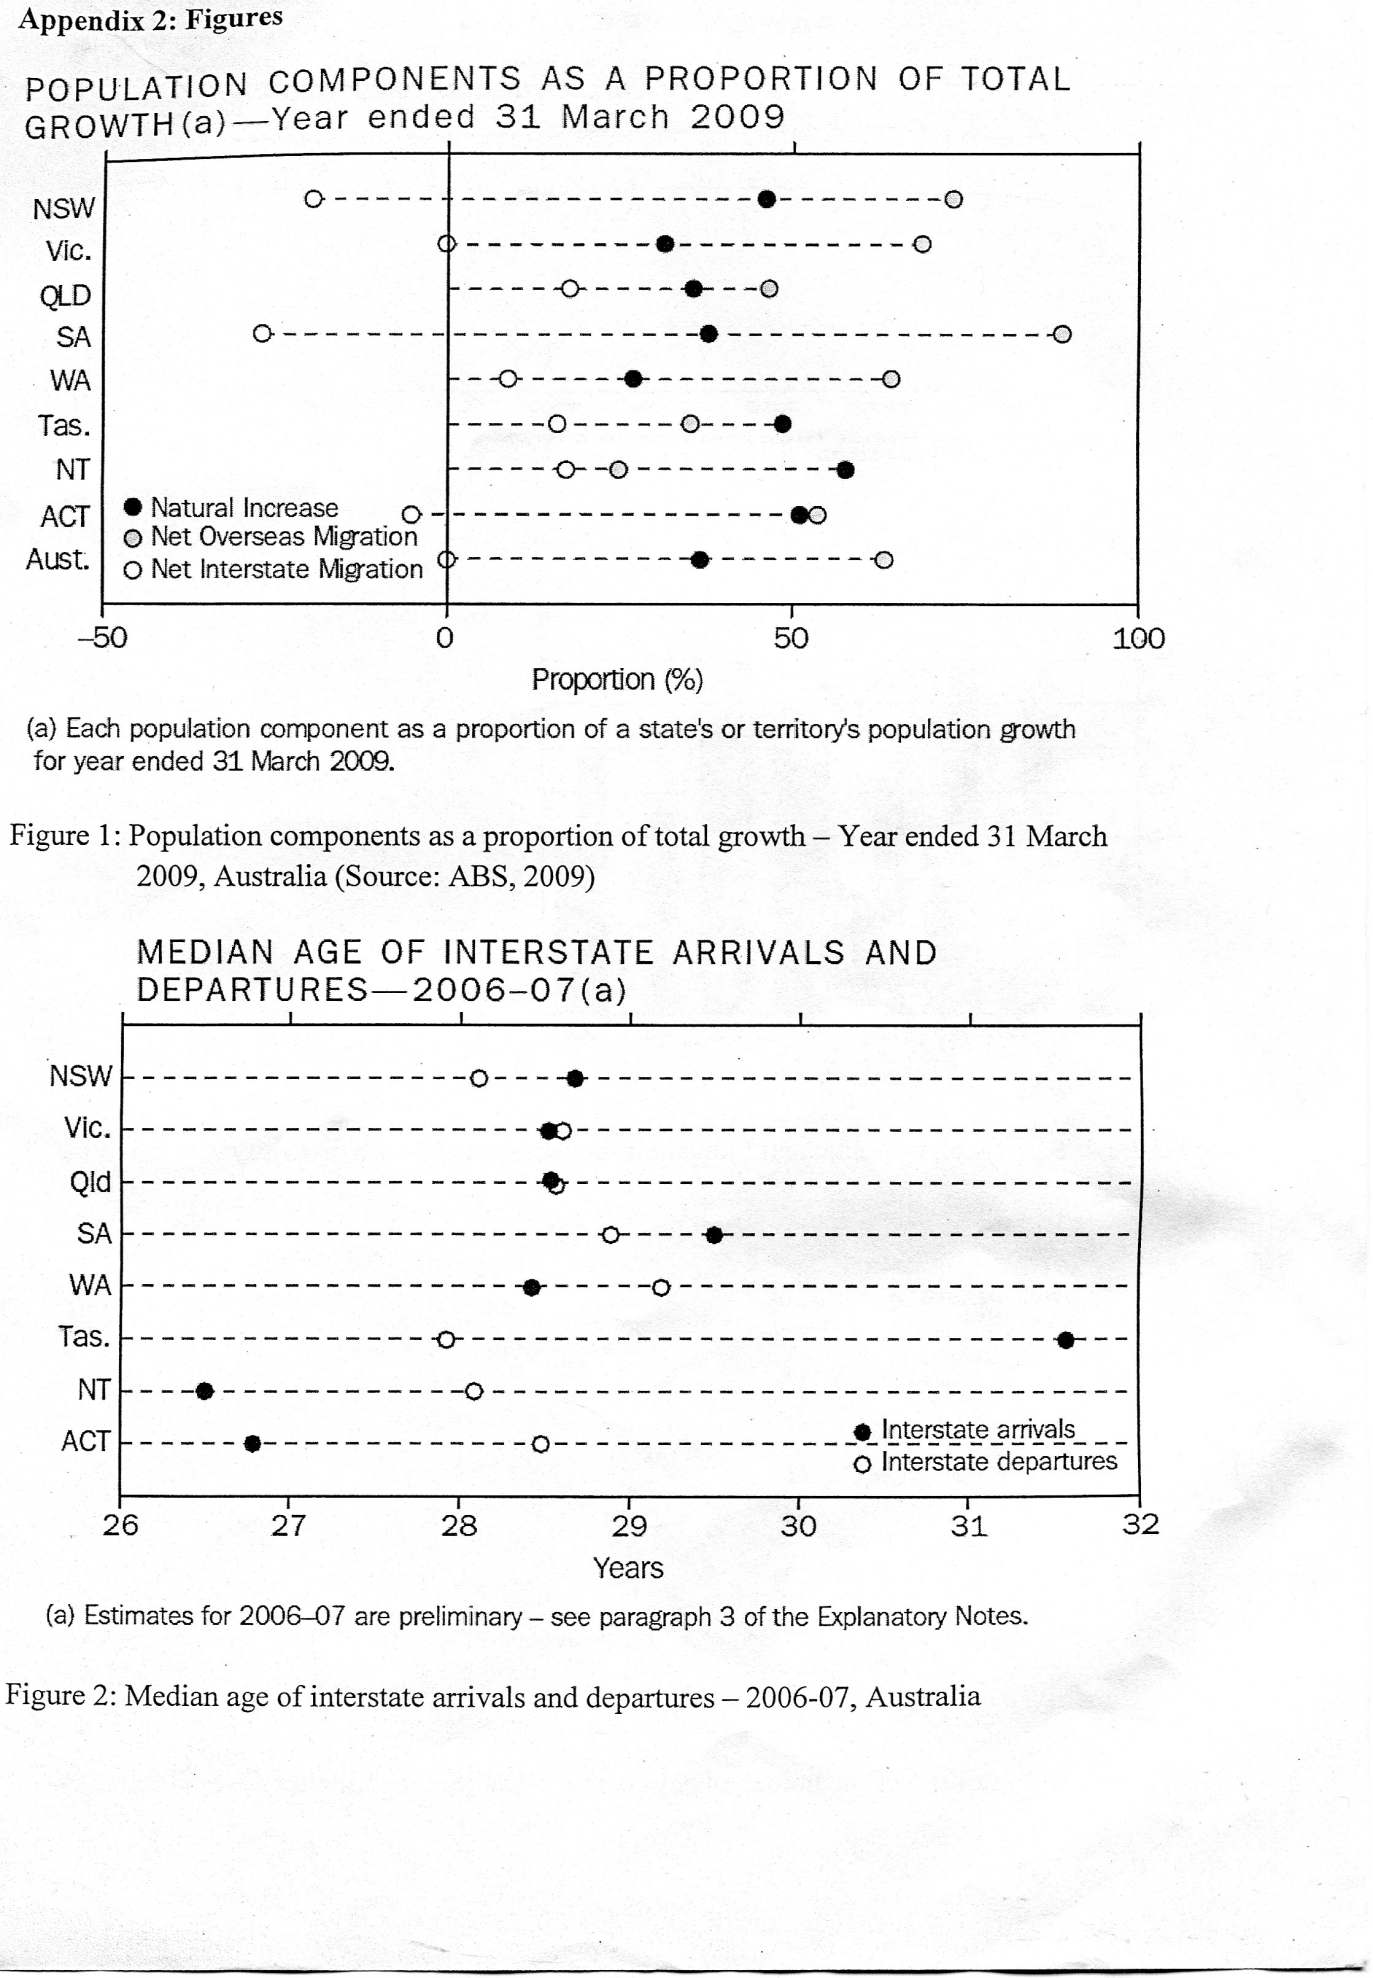
Figure 1 shows that NSW population growth is fuelled by over seas migration compared to Tasmania’s from natural increase (birth minus death). This may be due to increased job opportunities in NSW compared to Tasmania. Tasmania’s positive net instate migration may be due to retiree’s moving in to its low cost of living standards. According to figure 2 Tasmania’, interstate arrivals have higher median age of 31.6 and the median age of arrivals are for years older than the departures. This difference contributes to faster aging of the Tasmanian population (ABS, 2011).
In the 2006 Census, 85.8% of persons usually resident in New South Wales were Australian citizens, 23.8% were born over seas, mainly from England, china, New Zealand and Vietnam. Therefore Tasmania is less diversified culturally to NSW (ABS, 2007).
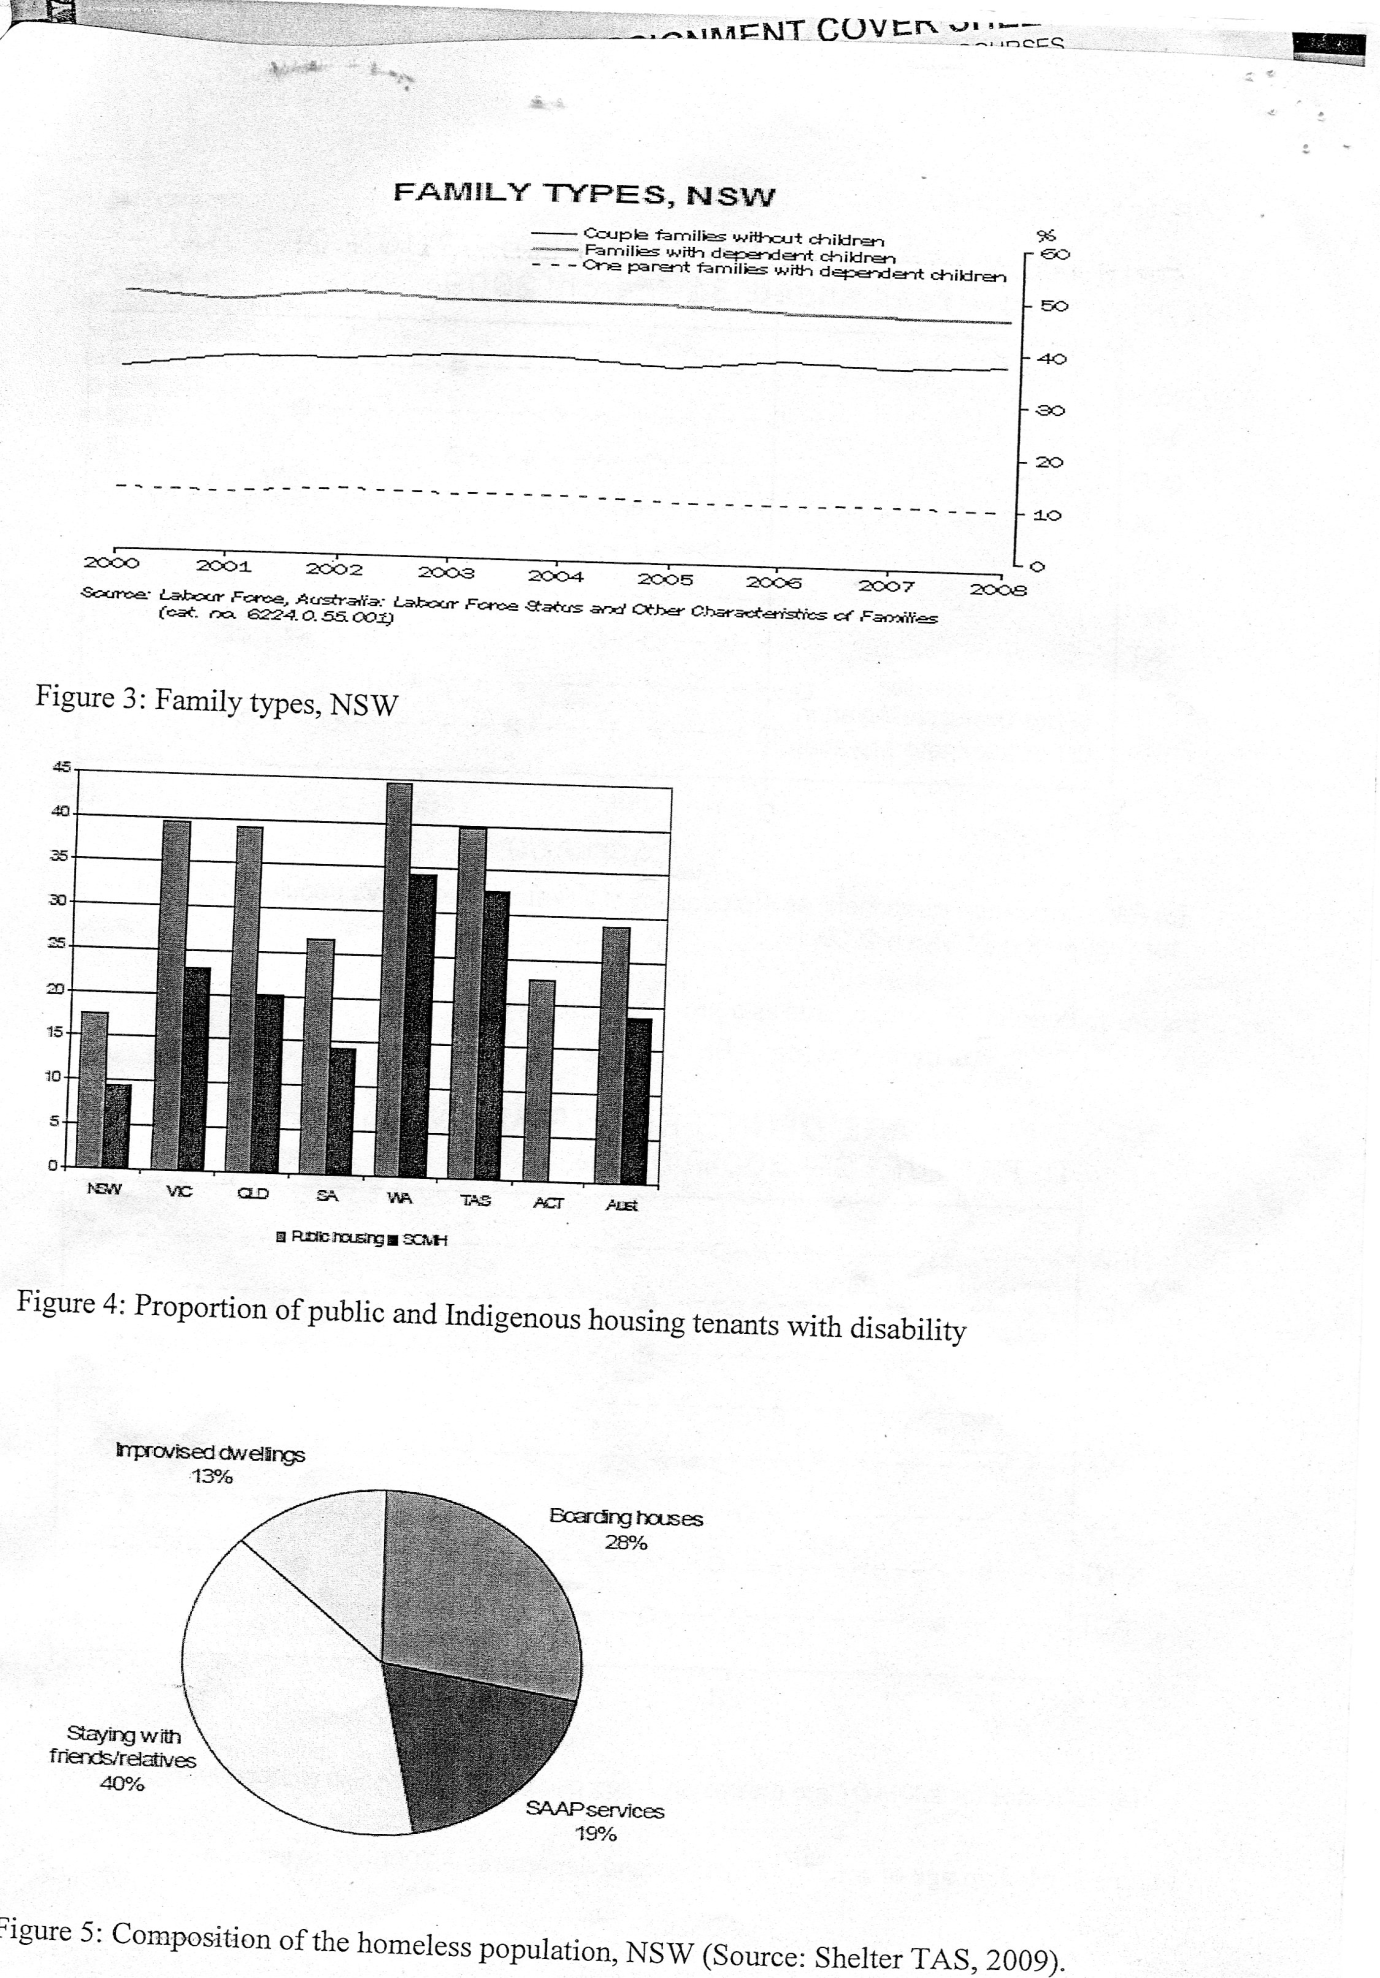
Comparing to figure 3, Tasmania has less family with children and more families with no children and one parent family relates to its small population growth (ABS, 2008).
According to Table 2, Tasmania has higher divorce rate and increased length of marriage before divorce than NSW.
Table 3 shows that NSW have more flats and townhouses to reflect increased concentration of people in urban areas and smaller family size. Due to higher house prices, mortgage repayments of $2,014 a month in Sydney is much higher $1,306 a month in Hobart. Also median weekly rental in NSW was $230 (ABS, 2008).
Table 4 shows more Tasmanians are home owners (69.1, compared to 68.4%) and also more likely to rent (24.6% compared to 22.8%). This results explains that households headed by an older person (ABS, 2011).
According to figure 4, tenants with disability in Tasmania were nearly 45% higher than in NSW which relates to increased ageing population (Shelter NSW, 2011). Table 5 shows lower rates of homelessness in NSW at 41.8 and figure 5 shows that majority staying in boarding houses (Shelter TAS, 2011). In NSW domestic and family violence (17.5% and relationship/family breakdown (11%) causes homelessness (ABS, 2011).
Referring to table 6, NSW workers earn more than Tasmanians by around $350 more weekly on average. NSW average household net worth was also more around $220,000 (ABS, 2011). But a bank West financial report (Table 7), show that Tasmanian were “Financially Fit” than NSW which may relate low housing and living costs and high asset levels relative to debt and income (Bank West. 2011). Referring to figure 8, NSW had 4.7 million workers in similar concentration of employment sector to Tasmania except NSW have nearly doubled employment in skilled occupation (professional, scientific technical services, financial and insurance services) which
Relates to its increased number of skilled migration.Meanwhile Tasmania has higher employment in health care and social assistance reflecting its higher number of ageing population (ABS, 2007).
In February 2011, skilled vacancies decreased in both states but NSW experienced significant decrease of 62.1% and it reflects in NSW higher unemployment rate. As at August 2011, NSW had higher employment (69.6%) and unemployment rate (6.1%). Over the 12 months in February 2011,employment trend increased in Tasmania (3.4%) but contracted in New South Wales(Wokplace,2011).It is alarming that Tasmania has 43.1% mature age workers (45 years and over)compared to NSW of 38.8%(Skillsinfo,2011).
Referring to Table 9, NSW have more people wealth literacy scores of Level 3 and above. This may relate to increased working people with non-school qualification in NSW, as shown in Figure 6.NSW’s higher health literacy level may relate to increased skill worker as shown in Figure 7, those employed in occupations requiring greater education and skill levels were more likely to have higher health literacy, with 71% of professionals at or above Level 3 compared with 24% of laborers. Tasmania’s lower health literacy level would relate to increased difficulties in health education and promotions (ABS, 2011).
Referring to Table 10, NSW’s SDR is lower at 5.9 and there is high difference between female and male. Referring to Tables (11-16),compared to Tasmania, NSW have lower mortality and morbidity issues with exception to a higher number of death due to unknown cause and it is alarming because no particular action can be targeted without knowing the cause. But Tasmania’s high number of death due to external causes such as suicide, transport accidents, falls, poisoning etc compared to NSW could relate to increasing ageing population and decreased health literacy level resulting in decreased disability to understand and recognize health dangers before it becomes fatal (ABS, 2011).
Health interventions
The aim of the health promotion is to raise awareness into ageing population and associated chronic disease and disability problems and to enrich the older person’s quality of life ,decrease work related injury, compensation claims, absenteeism and reduce the pressure future health budget. The target audiences are the working age population (15-65). So that they could age healthy. The areas to be targeted are:
Train the health professional’s essential assessment and communication skills to facilitate effective implementation of health promotion due to low health literacy level of the population.
Target workplaces to increase workplace participation and quality of working life of older people and to ensure that demands are met. While ensuring supportive and stress free transition from work ton retirement.
Involve the community to identify their concerns. Improve access to safe and stimulating environments to increase participation of older generation in educational and social activities ton prevent loneliness and isolation.
Promote healthy lifestyle such as health food and eating habits, increase level of physical activities, cessation of smoking and alcohol intake.
Raise awareness of mental issues relevant to older people, such as depression and dementia. Increase the provision of psychosocial interventions for older people. Establish support centers to provide preventative health services such as vaccinations essential resources to facilitate and encourage behavioral changes (DHHS, 2011).
Justification of health interventions
Training of health Professionals with essential skills such as assessment of lifestyle behavior, identification of behavioral changes, counseling skills and communication skills will be helpful in overcoming low health literacy level and facilitating community participation in health promotion.
Also adequate preparation of the health professional is essential in gaining the social trust which is important in facilitating mutual co-operation.Increased social trust would increase participation and compliance of the health promotion strategies.
Effective community participation will empower the community to identify and a social issue of concern to them and strategies to address these with decreased health professional’s involvement. Health interventions will be more effective if individuals can analyze and identify what needs to be done to bring about change.
Capacity building within organizations is paramount in supporting an ongoing community participation process. For example initiating health policy changes or encouraging workplace to provide better treatment to older workers will increase participation and decrease work related health issues.Apart from providing ongoing support and training for the health team organizations will also be responsible in providing preventative services, resources and assistance to the community to meet the goals of the health promotion.
Maximizing the use of local community resources would promote local community involvement and individual self reliance and increase participation in the health promotion.
The involvement of workplace, age care service providers and community organizations in additions to the health sector can Facilitate coordinated effort in achieving the aim of the health promotion.
Evaluation of existing programs or values for its effectiveness is essential so that same mistakes will not be repeated. Also health promotions should be based on responses to a particular situation so that programs are accurately geared towards their target audience and their health concerns are taken into account (Monash University, 2011).
Conclusion
In comparison with New South Wales, Tasmanians main disadvantage is their ageing population due to associated problems such as increased need and dependence on health care services, decreased workplace productivity and economic activities and overall decrease in quality of life as illustrated by the higher mortality and morbidity data.
Therefore the health promotion was concentrated in raising awareness into healthy ageing to create a healthy, happy and independent ageing population and as a result the current health issues can be reduced. The biggest obstacle of the health promotion program would be to overcome the low level health literacy level and it is being addressed by providing adequate training for the health promotion
Reference List
Australian Bureau of Statistics (ABS), (2011). Adult literacy and life skills survey. Summary results. Web.
Australian Bureau of Statistics (ABS), (2011). Australian Social Trends – March 2011.
Australian Bureau of Statistics (ABS), (2011). Causes of death. Web.
Australian Bureau of Statistics (ABS), (2011). Community Overview. Web.
Australian Bureau of Statistics (ABS), (2011). Education.
Australian Bureau of Statistics (ABS), (2011). Family and Community. Web.
Australian Bureau of Statistics (ABS), (2011). Migration.
Australian Bureau of Statistics (ABS), (2011). NSW State and Regional Indicators, 2011. Web.
Australian Bureau of Statistics (ABS), (2011). Offenders. Web.
Australian Institute of Health and Welfare (AIHW), (2011). Injury Deaths, Australia, 2004-05.
Australian Institute of Health and Welfare (AIHW), (2011). Projections of Future demand. Web.
Australian Natural Resources Atlas (ANRA), (2011). Overview Tasmania. Web.
Australian Bureau of Statistic (ABS), (2011). Quick Starts: New South Wales. Web.
Bank West, (2011). Tasmania is Australia’s Most “Financially Fit” State. Web.
Demographic Change Advisory Council (DCAC) (2011). Tasmania’s Workforce: Health Impacts on participation and productivity in the face of ageing generation. Information paper No. 2. Web.
Department of Health and Human Services (DHHS), (2011). Tasmani’s Health Plan.
Department of Immigration and Citizenship (IMMI), (2011). Annual Report 2007-08: Economic Migration. Web.
Government of Tasmania (DOET), (2011). Qualifications and Skills for Tasmania Tomorrow. Web.
Monash University, (2011). Sharing Power Principles for Community Participation in Health Promotion. Web.
Queensland Health, (2011). Primary Health and Community Care in Queensland Health2002 – 2007: What is a Community? Web.
Shelter, NSW, (2011). Housing Australia Fact Sheet: A quick guide to Housing facts and figures. Web.
SkillsInfo, (2011). Regional Employment Overview. Web.
Victorian Council off Social Services (VCOSS), (2011). Community Engagement and Climate Change: Benefits, Challenges and Strategies. Web.
Workplace, (2011). Are you looking for a job in Australia? Web.
Workplace, (2011). Australian Regional Labor Markets. June Quarter, 2011. Web.
Appendix 1: Tables
