Introduction (Background)
A manufacturing firm that produces rings to link plastic pipelines. The production process is a rigorous one, involves many processes, and is driven and controlled by a variant number of machines and many people, which makes them difficult to control and troubleshoot problems. The quality manager suspects that there is an underlying problem so he collected the data of ring diameters during production runs as shown in table 1.
Table 1: Sample data of ring diameters during production runs
This report will analyze the collected data of ring diameters during production runs using a range and control chart and will provide recommendations for the manager on the results.
Range and Average Control Charts
- Number of samples, k = 25
- Sample size, n = 4
Overall Process Average (Mean) for Ring Diameters,

Average Range for Ring Diameters,

Since, process standard deviation is unknown, therefore, using control limits for construction of Range and X-bar charts.
From table 2, for n = 4, A2 = 0.729, D3 = 0, and D4 = 2.282
Table 2: Factors for Computing Control Chart Limits
Control Limit for Average (X-bar) Chart
Upper Control Limit,

Lower Control Limit,

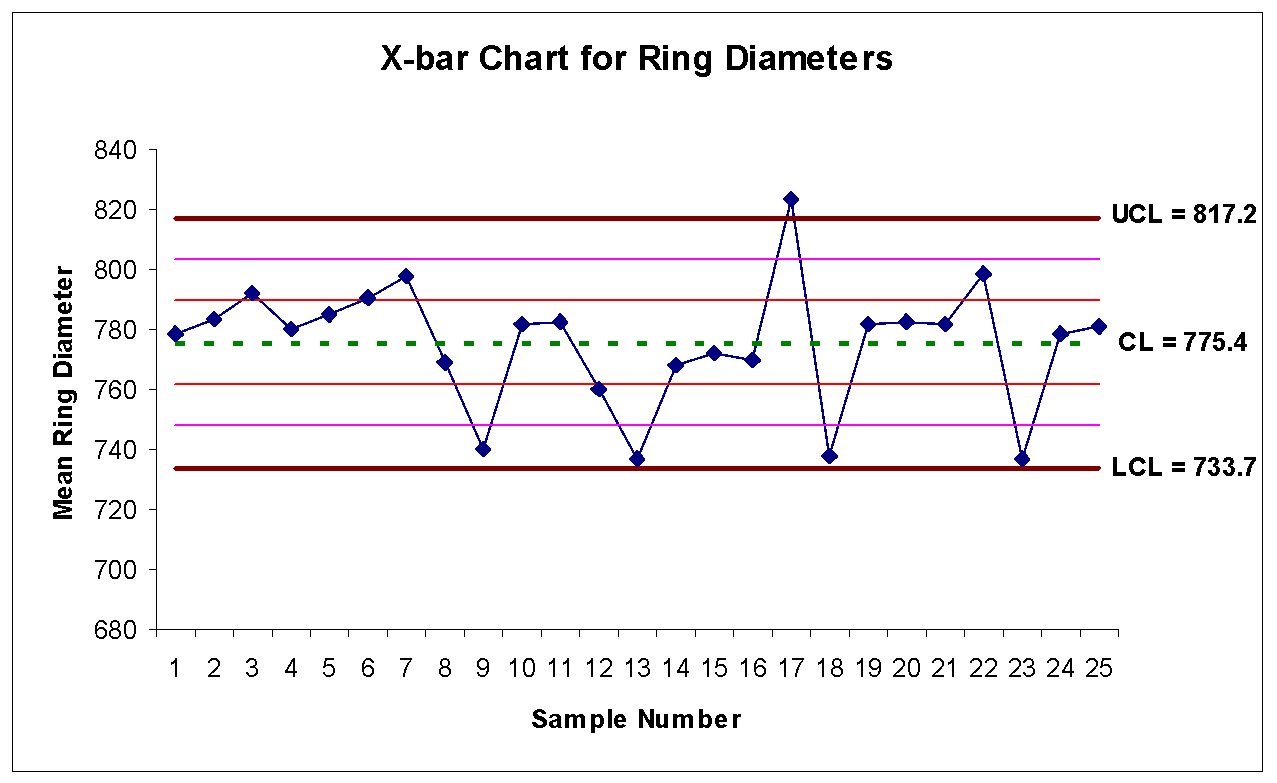
The upper, central and lower control limit for the X-bar Chart in this process is 817.1, 775.4 and 733.7, respectively. Figure 1 shows the X-bar chart for ring diameters.

Control Limit for R Chart
Upper Control Limit,

Lower Control Limit,

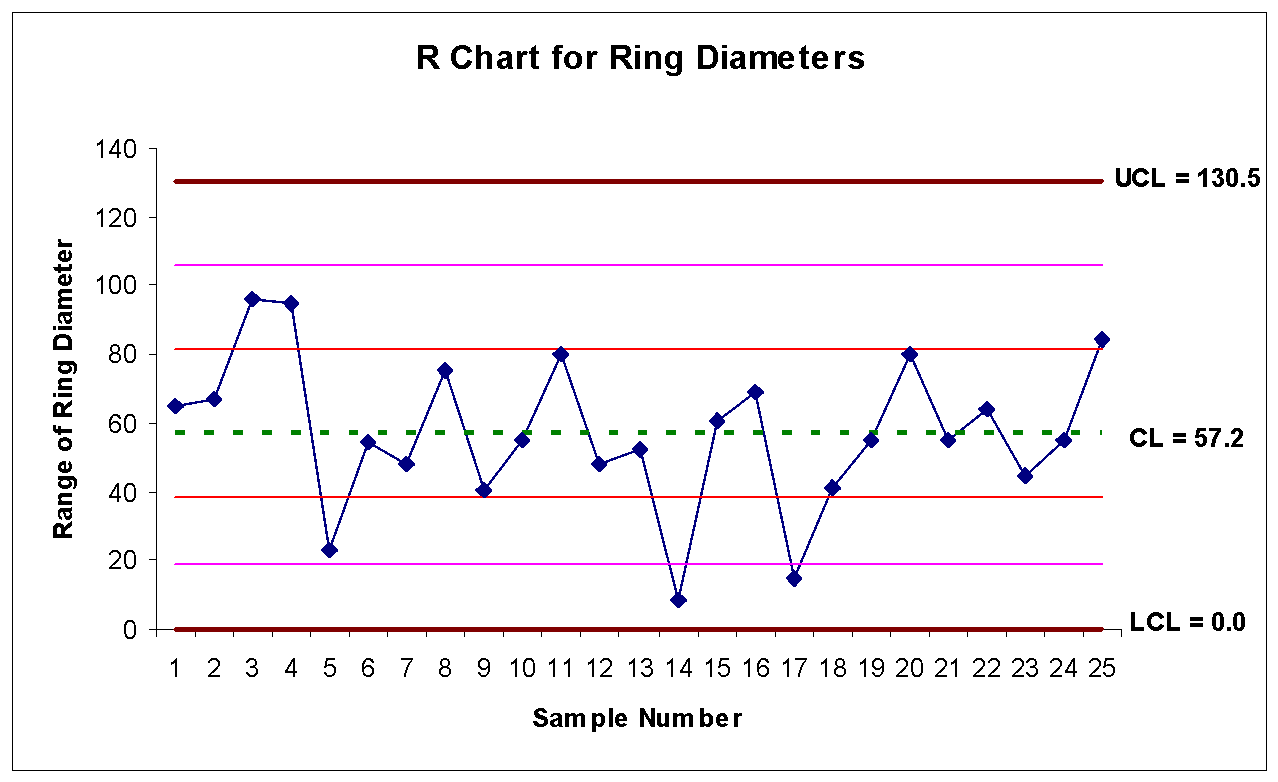
The upper, central and lower control limit for the R Chart in this process is 130.5, 57.2 and 0, respectively. Figure 2 shows the Range chart for ring diameters.

Interpretation of Range and Control Chart
R chart is used for monitoring the system variability. R chart that is in control indicates that the system’s precision has not changed. As shown in figure 2, there is no point outside the upper control limits and the points are scattered as we move from left to right. In addition, there are no consecutive points above or below the average range line (CL = 57.2).
However, there is a pattern with more than 2/3 of the points in the middle 1/3 of the control limits. Thus, production process variability is not in control. Since the range is not in control, therefore, there is no need of looking at the average chart.
However, if we see the average chart, we can clearly see a pattern as there is a point outside the upper control limit, there is a run of 7 consecutive points above the average line (CL = 775.4) and also there is a pattern with about 2/3 of the points in the middle 1/3 of the control limits. Thus, production process variability and accuracy is not in control.
Conclusion
The quality manager’s concern that there is an underlying problem is correct. Therefore, it is recommended that the quality manager should take necessary corrective action so that the production process variability comes in control. Once, variability of the production process comes in control then the production process will be accurate in producing rings to link plastic pipelines.