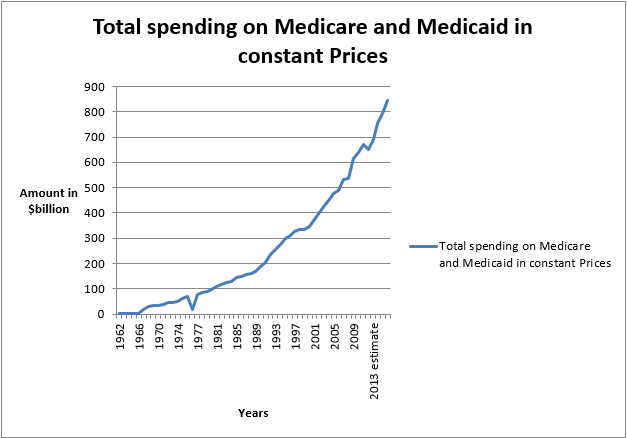
Trend of total spending on Medicare and Medicaid
Spending on Medicare and Medicaid has been on an upward trend since 1962. In 1962, the spending on Medicaid was $103billion. This increased to $272,771 billion in 2010. Similarly, total spending increased from $2,525 billion in 1967 to $446,477 in 2010. The spending on Medicare and Medicaid has been on an upward trend.
This can be attributed to the fact that spending on Medicare and Medicaid is a mandatory spending in the US government. These are part of entitlements given to people who meet certain eligibility requirements. These spendings form a major component of the federal budget. They account for about 52% of the total budget. The Medicare and Medicaid is directly proportional to GDP and population.
As population increases and GDP increases, the spending on Medicare and Medicaid also increases. Further, an increase in the number of unemployed citizens and retirees also contributes to the increase in total spending on Medicaid and Medicare because they receive substantial amount of the mandatory spending.
Further, increase in pricing of medical services necessitates the state to increase the allocation on Medicaid and Medicare that can match the increases in pricing. The graph below shows the trend of spending on Medicare and Medicaid.
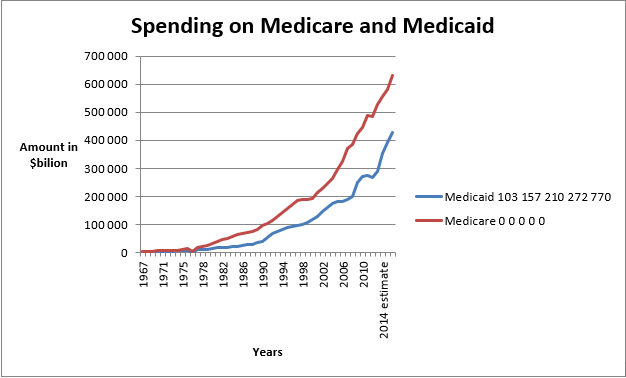
From the graph is is evident that spending on Medicare and Medicaid had an upward trend since 1962 to 2016. The values have increased gradually from 1962 to 1986. Thereafter it started increasing rapidly over the year.
The trend after 1986 is characterized by the steep upward slope. Also, it is evident that spending on Medicare is greater than spending on Medicaid over the period under review. The graph below shows the trend of total spending on Medicare and Medicaid.
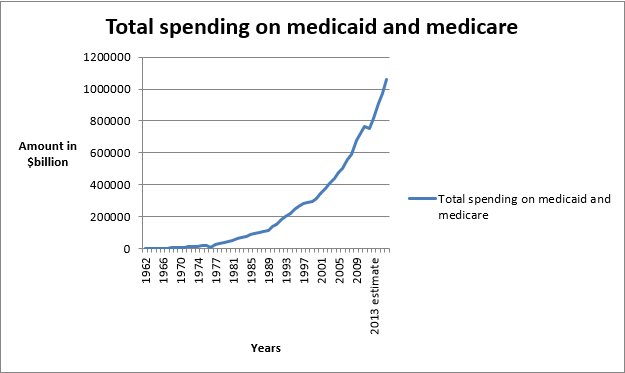
From the graph, the spending on Medicaid and Medicare put together took a similar trend as the individual spending. There was slow growth from 1962 until 1977 thereafter it experienced a steep increase. The graph below shows the trend of the percentage change of total spending on Medicaid and Medicare.
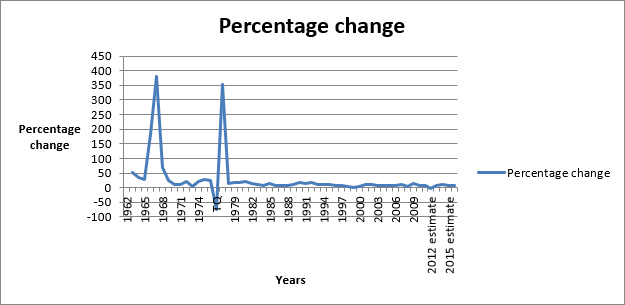
From the graph it is evident that the percentage change in total spending from year to year has been erratic since 1962 to 2016 (estimates). This can be attributed to the dynamics in the economy ranging to from changes in GDP, changes in population structure, changes in the unemployment rate among others.
The total spending on Medicare and Medicaid can also be analyzed as a percentage of total spending on mandatory programs in the economy. In 1962 the percentage of total spending on Medicare and Medicaid as a percentage of total spending was 0.37%. The percentage increased to 37.6% in 2010.
The value has been gradually increasing over the years. The graph below shows trend of increase in total spending on Medicare and Medicaid as a percentage of total spending on mandatory programs.
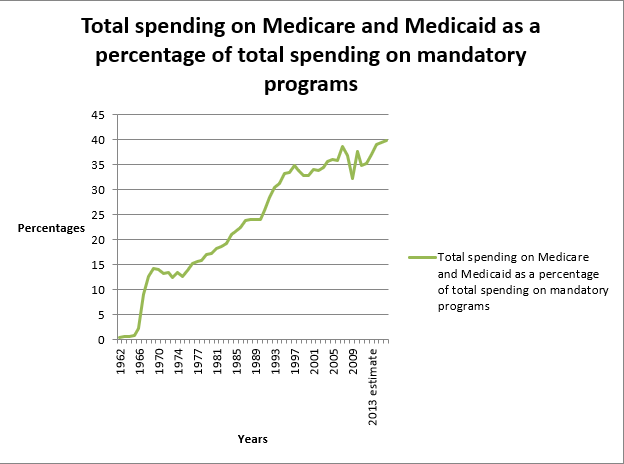
In the graph, it is evident that the total spending on Medicare and Medicaid as a percentage of total spending on mandatory programs has been increasing steeply over the years. It is mainly attributed to increase in cost of medical services in the country and many more factors. As at 2015, the state estimates that it will be spending more than 40% of the total allocation for mandatory programs on Medicare and Medicaid.
Finally spending on Medicare and Medicaid can be compared with current and constant prices. The total amount of spending on Medicare and Medicaid in constant dollars is less than $1,000billion for all the year. When plotted together with total spending in current dollar, the values are negligible as shown below.
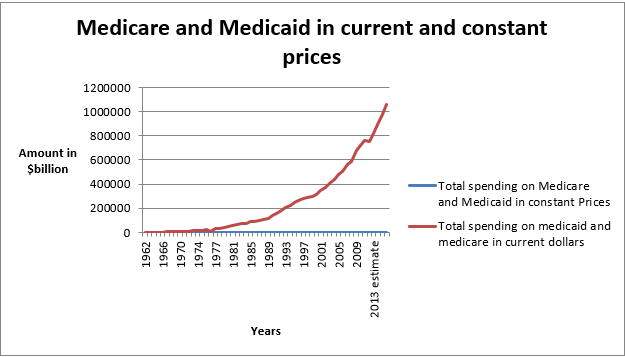
When total spending on Medicare and Medicaid in constant dollars shows an upward trend as plotted in the graph below.
