Introduction
Performance in organizations is subject to numerous factors, which interact and collectively influence how processes, operations, and activities take place. In a bid to streamline and optimize processes, operations, and activities, managers have come up with diverse methods of quality management. The nature of quality management differs from one organization to another depending on the type of products or services that they offer and complexity of operations, processes, and activities they undertake. Essentially, quality management is a measurable control intervention aimed at ensuring that there is a constant and consistent flow or production of services and products in an organization (Jones 2014). Quality management does not only increase production and profitability in organizations but also promotes effectiveness and efficiency in the production of goods and delivery of services. Thus, managers employ quality management in adjusting operations, processes, and activities to work optimally and efficiently to avoid wastage of resources.
In the service industry, time is an important factor that determines the quality of services that customers receive. In the hotel industry, banking industry, transport industry, and the aviation industry, customers waste a great deal of their time as they seek services. The waiting time, in some instances, is very long, and thus, reduces the quality of services that customers receive. In their study, Kumar, Batista, and Maull (2011) established that the operational performance of an organization have marked influence on customers for it determines customer satisfaction and loyalty. Customers prefer services that are timely and convenient for they do not waste their time in seeking and consuming them. In essence, organizations that provide timely and convenient services have a competitive advantage in the service industry. In this view, quality management ensures that there is minimal waiting time during the provision of services to sustain the quality of services and improve customer satisfaction.
The case study of the aviation industry illustrates the essence of quality management in improving the performance of operations, processes, and activities in an organization. The complexity of the operations in the aviation industry highlights the need for quality management to ensure that all operations, processes, and activities promote the quality of services according to the requirements and expectations of customers. The analysis of the performance of transport security administration (TSA) shows that they are responsible for major delays at airports due to their poor performance. Matthews (2016) notes that summer season, shortage of staff, slow approval of funds, uninformed travellers, insufficient information, lateness, lack of alternative pre-check points, few sniffer dogs, and carrying of prohibited items are some of the factors in the airport, which have contributed to delays and lengthened waiting times. Thus, it is apparent that TSA has performance issue requiring the quality management to streamline operations, processes, and activities at the airport.
The project aims to enhance understanding of the factors contributing to delays at airports and apply statistical process control (SPC) in describing the cause of these delays and provide an appropriate solution to the management to improve security performance in the airport. SPC provides a statistical method for assessing the influence of numerous factors on a factor of interest (Jones 2014). In describing the causes of delays, the project categorized these causes into people, method, machine, environment, and materials. Fundamentally, the project aims to categorize and rank the causes of delays using a fishbone diagram. In undertaking further analysis of the case of delays in the airport, the project employed the run chart and capability charts (Cp and Cpk charts). Effective analysis and interpretation of data offer robust findings, which are integral in the decision-making to improve the performance of security operations at the airport.
Methodology
The project identified numerous factors that contributed to delays at the airport by undertaking research. In his article, Matthews (2016) provided important information regarding the causes of delays for he noted that summer season, shortage of staff, slow approval of funds, uninformed travellers, insufficient information, lateness, lack of alternative pre-check points, few sniffer dogs, and carrying of prohibited items are some of the causes. To determine the trend and patterns of delays in a day, the project collected data from the airport and recorded the occurrence of delays in each hour for 24 hours.
In the analysis of factors that caused delays at the airport, the project used a fishbone diagram. The diagram effectively presented potential causes of delays at the airport for it categorized causes into people, machine, material, environment, and method. Moreover, the project employed statistical process control in analyzing the data and deriving pattern and trends that are relevant to the study. Primarily, the project used the run chart in depicting the trend and pattern of variation of delays in the airport in 24 hours. In determining the extent of variation of the data, the project employed control chart for it exhibits a variety of data with lower and upper specification limits. The project also used Cp and Cpk chart in assessing the consistency of process capability (Cp) and consistency of the process capability to certain specifications such as mean and standard deviations. Overall, the project analyzed the data and interpreted the findings effectively to provide robust information.
Graphs and Analysis
Cause-and-Effect Diagram
The cause-and-effect diagram is appropriate in depicting causes of delays at the airport because it outlines potential causes and categorizes them into their respective realms. Okes (2009) asserts that the fishbone diagram allows a visual representation of factors that influence a given phenomenon, and thus, illuminates their influential contribution. In Figure 1, it is evident that factors that affect waiting time fall into five categories, namely, man, method, material, environment, and machine. In the aspect of human factors, the diagram illustrates that shortage of staff, slow approval funds for hiring staff, and bringing prohibited items delays security check while early arrival and checking own bag hastens the process screening. The nature of method had marked influence on waiting time since pre-check programs, training of staff, use of sniffer dogs, adoption of Disney’s fast-pass strategy, and education of customers have a positive impact on waiting time.
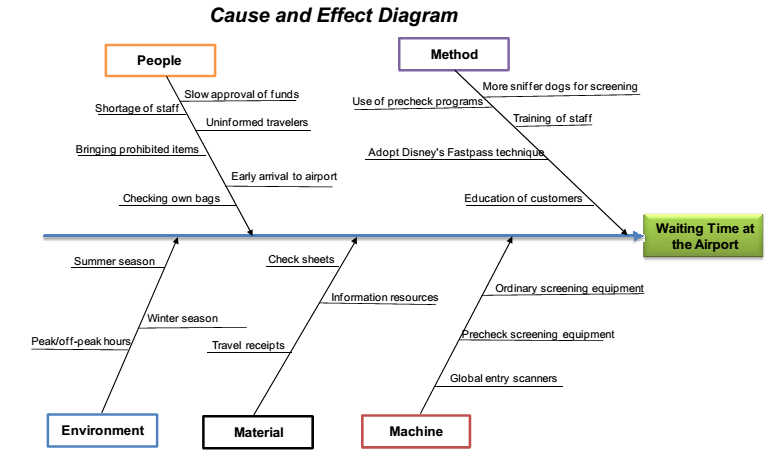
From the environmental perspective, the summer season and peak hours increase waiting time for customers flock to the airport while winter and off-peak hour reduce waiting time for the number of customers diminishes significantly. Effective recording of check sheets and travelling receipts, as well as the provision of information resources, reduces the time of waiting for minimal errors occur and customers access beneficial information easily. The use of screening machines such as serviced ordinary scanner, pre-check screening equipment, and global entry scanners are the types of equipment that reduce waiting time in the airport.
CP and CPK Chart
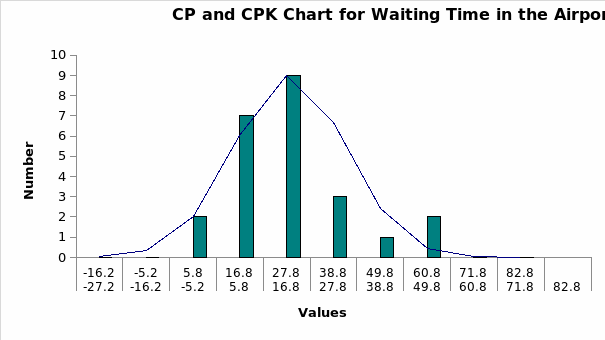
Cp and Cpk chart is important in interpreting waiting time in the airport because it indicates the degree of variation from the central point. Cp is a process capability that measures value in an unrestricted region while Cpk is a process capability that measures value in a restricted region (Pries 2009). The chart is important because it provides two forms of measurements, which indicate the degree of process capability of waiting time at the airport. From the chart, it is evident that the limits are not the same as the upper specification limit is 62.4 while the lower specification limit is 16.2. The waiting time has Cp of 1.21 and Cpk of 1.20, which means that there is no data out of the specification limits.
Run Chart
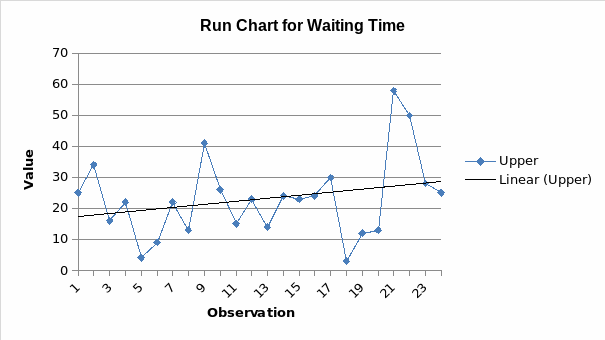
The run chart is relevant in the analysis and presentation of data related to waiting time because it depicts trends and patterns of variation over time. Essentially, the run chart measures variation or stability of operations, processes, and activities (Pries 2009). Although trends and patterns of data may appear variable, construction of a trend line reveals the stability of data over time. In this case, the trend line increases with time, which means that waiting time at the airport increases with time each day. The run chart confirms that early arrival at the airport enables one to avert long waiting time than a late arrival.
X-Bar-Range Chart
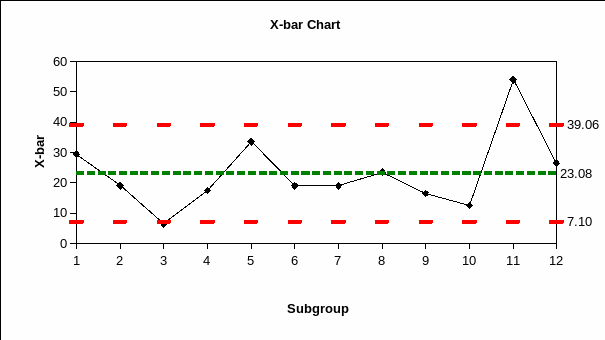
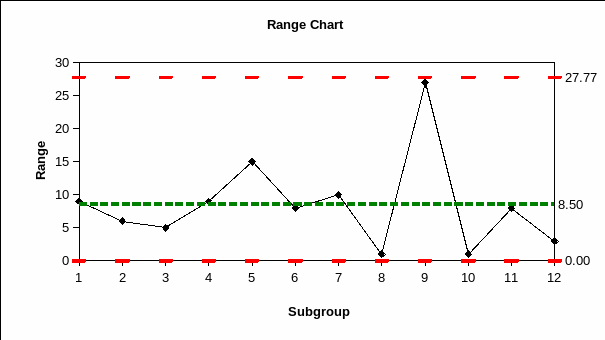
X-bar-and-range charts are important in illustrating the distribution of waiting time within the mean and the range margin. Mcintyre (2009) holds that x-bar-range chart depicts the pattern of the mean in one graph and the pattern of the range in another group with a view of highlighting variations. The x-bar chart shows that the distribution of values is out of range for some values are beyond the control limits. For example, the third value is below the lower control limit while the 11th value is above the upper control limit. However, the remaining 10 values are within the lower and upper control limits, which mean that most values are within the distribution of the mean. In comparison, the range chart indicates that the distributions of values are not out of range limits. These findings suggest that waiting time in the airport is somehow unstable over time as depicted by the variation in data points.
Conclusion
Quality management plays a central role in the management of operations, processes, and activities in an organization. Specifically, statistical process control allows monitoring and quantification of operations, processes, and activities to ensure that they occur optimally in an organization. As a case study, the analysis of the waiting time in the airport revealed several insights regarding the patterns and trends of waiting time as well as numerous factors that cause delays. Fishbone diagram effectively illustrated that summer season, staff shortage, staff training, customer education, pre-check screening, and lack of information are some of the factors that have both negative and positive influence on waiting time. Cp and Cpk show that the distribution of data did not exceed the specification limits. The run chart shows that waiting time increases with time while x-bar-range exhibits data that is out of range, which reflects the variation in waiting time in a day. These findings show that the waiting time is highly variable in the airport depending on the time of the day that one chooses to travel.
References
Jones, E 2014, Quality Management for Organizations Using Lean Six Sigma Techniques, CRC Press, New York.
Kumar, V, Batista, L & Maull, R 2011, ‘The Impact of Operations Performance on Customer Loyalty’, Service Science, vol. 3, no. 2, pp. 158-171.
Matthews, D 2016, Slow TSA security lines are causing huge airport delays: Here is how to beat them. Web.
Mcintyre, W 2009, Lean and Mean Process Improvement, Cambridge University Press, Cambridge.
Okes, D 2009, Root cause analysis: the core of problem solving and corrective action, Milwaukee, ASQ Quality Press.
Pries, H 2009, Six sigma for the new millennium: A CSSBB guidebook, ASQ Quality Press, Milwaukee.