Introduction
It can be effective to use the time-series research similar to the one implemented to evaluate the effectiveness of the behavioral intervention (Babbie, 2016). The same time span and days should be used to make sure that the data obtained will be free from the influences of other factors.
At that, it can be more effective to choose the same part of the day as different factors may come into play. For instance, on other days, Kaya can be more nervous due to certain home or school factors (meeting some people, having more tasks to do, and so on). During different parts of the day, Kaya can also feel differently (as she can feel hungry, tired, homesick, and so on). Hence, the time will be almost the same but the period during classes and recess will be chosen. It can be beneficial to observe the participant’s behavior for two weeks.
Analysis
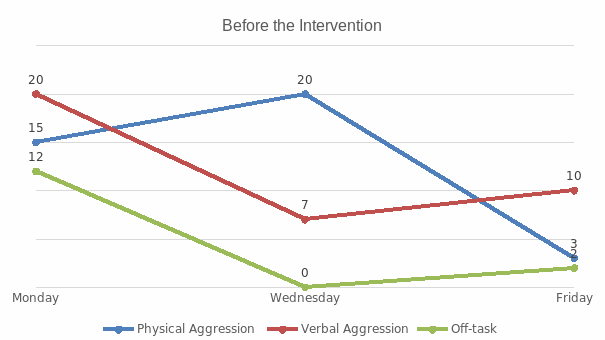
It is possible to use time and frequency domains to collect, interpret, and present data (Senter, n.d.). I would use the time domain as it can reveal some peculiarities of Kaya’s behavior at certain periods of time as well as evaluate the change in her behavior if any (see Figure 1). The graph-based framework can help analyze the data and predict the changes if any (Yadav & Toshniwal, 2011).


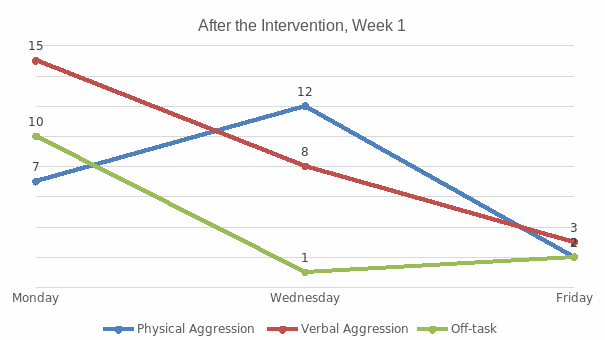
The data collected after the intervention show a certain improvement of Kaya’s behavior in terms of the three domains under analysis (see Figure 2). The major improvement is apparent within the domain of physical and verbal aggression as the frequency of expression of aggression decreased significantly (almost by half).
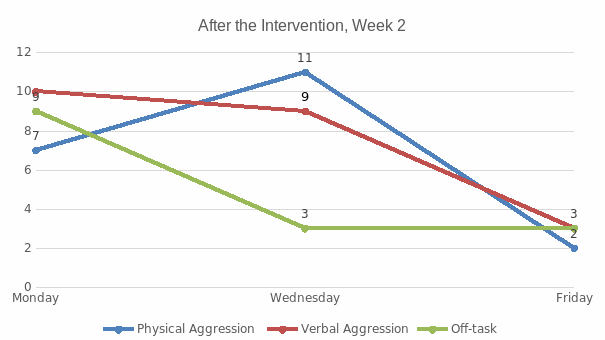
Nevertheless, the cases of physical and verbal aggression became more frequent on Wednesday, which may be explained by other factors affecting Kaya’s behavior. At that, the frequency of off-task behavior remained almost unchanged, which may mean that the intervention has no effect on this domain. The observation during the second week led to quite unexpected results. The frequency of undesired behaviors was still quite high on Monday. Such data show that the days spent at home (without the intervention) had an adverse effect on Kaya’s behavior.
The observation shows the moderate effectiveness of the intervention developed. Kaya’s behavior changed significantly and the frequency of undesirable behaviors reduced. Nevertheless, the domain of off-task behavior remained almost unchanged, which reveals the need to address this issue. Importantly, the observation during the second week unveiled the importance of parental engagement. It is clear that parents should also be a part of the intervention. They should perform the role of the instructor at home. In this case, Kaya can acquire important social skills. Although the frequency of physical and verbal violence is still quite high, it is clear that the intervention should be modified. More attention should be paid to Kaya’s off-task behavior.
Conclusion
In conclusion, it is necessary to note that time-series research can help the researcher identify and predict trends. It is comparatively easy to implement, and it is rather effective. The presentation of the data obtained is also essential, so graphs should be used to make the information easy to evaluate. The analysis implemented shows that the intervention is moderately effective as the frequency of undesirable behaviors reduced, but Kaya still displayed verbal and physical violence. Therefore, it is important to improve the intervention.
References
Babbie, E. (2016). The basics of social research (7th ed.). Belmont, CA: Cengage.
Senter, A. (n.d.). Time series analysis. Web.
Yadav, V., & Toshniwal, D. (2011). Graph based framework for time series prediction. Trends in Information Management, 7(2), 74–83.