Introduction
The genesis of Solow model emanated from various responses over the Harrod-Domar model. The major concern of Harrod-Domar model was on the possibility of availability, constancy, and alteration to a stable state. Steady state escalation results from exogenous technological change. In addition, this model is significant in understanding future economic growth or differences exhibited between countries in this globe.
Nowadays, Solow model has replaced the Harrod-Domar model in explaining the differences in income level over various countries (Jones 2002). Therefore, Solow model have come up with a combination of factors determining the income differences among countries. As a result, various researchers to tackle growth and development issues among countries have used the Solow model (Easterly and Levine 2001).
However, Mankiw, Romer and Weil (1992) had a different view on the way various textbook documented the Solow model. In most books, there is abbreviation of the authors who came up with this augmented Solow model as MRW hence this paper would use the same for this paper. In their view, MRW perceived the introduction of regression analysis to enhance Solow model could yield better description of data from various countries. Since then there have been empirical models formulations based on the augmented Solow model.
One of these researches emanated from paper presented by Klenow and Rodriguez-Clare (1997). KRC were on a view that introduction of accounting methods, there were differences in technological field as opposed to capital output ratio in defining differences in cross-country income.
Since the development of augmented Solow model by MRW in 1992, there have been many literatures coming up with various versions of this model. Researchers have revealed possibilities of incorporating other factors to this model to yield other measures of economic growth and incomes in countries. Some of these factors suggested by these researchers encompasses both core and noncore various. Some of the factors incorporated have been trade, FDI, inequality among others.
These factors have variables to define them categorised as variable and nonvariable. The core variables are determinant of the growth of a country and they include capital and labour. On the other hand, noncore variables are equally significant only that they do so with low magnitude. These noncore variables may include the inputs, salary, wages, and taxes among others (Gujarati and Porter 1988).
This study concentrated on the relevance of augmented Solow model in investigating the effects of these variables to the growth of India. There will be three sections in this study as required by the instructions guiding the assignment. The first section has the formulation of an empirical model using the noncore variables determining the growth of India and their influence to this country.
In addition, theoretical and empirical evidence were vital to support these variables. Section two included reputable data to study growth of India. The data used in this study came from the latest publication in World Bank World Development Indicators (WDI). Section three included use of Microfit 5.0 to run regressions as suggested by MRW.
Setting up an empirical model
This section will use additional noncore variable to set up an empirical model and its impact to the growth of the country of study. There are differences prevailing between countries that might have enhanced or hindered the growth of these countries. Each country depends on its output per worker in defining the growth of a country.
This forms the central point of Solow model as technology and constant capital output ratio remaining a core factor in any country. However, there are differences exhibited among countries depending on their geographical location, climatic conditions, disease prevalence, and institutional frameworks in these countries. However, after a certain time, these factors may stabilize over time but climate and geographic location are not easy to change toward economic differences.
Other factors either have in one-way affect the output of workers (labour) in directly or indirectly as the population grow. Technological differences have been quantifies and their differences measured among countries in regard to agricultural advancement level, presence of technologies in health facilities, and introduction of technology in institutions.
Therefore, it is clear that differences among various countries have a foundation on technological differences among countries in these three different areas, namely, climate, health, and institutions. Capital output ratio has been less determining to level of development among countries.
Alternative empirical model
One major model derived from Solow model is the famous Cobb-Douglas production function in conjunction with Harrod-neutral technology. Details from the two functions would yield the following function
Y=K α (AL) (1-α)
In which Y represents the output, A for technology, whereas L is labour. In addition, K would be an endogenous in the above function. Once L divides the function, there will be another function involving a log to make new arrangement of terms to yield the production elasticity. The ratio of capital output presented on the right hand side. Y/L=y and K/L=k hence, the second function would be
ln y = ln A + α ln (k /y) +ε
(1-α)
This step must include the marginal product of capital, which equals the technological change rate as g, downgrading rate as δ, labour force growth as n, and share of saving in GDP as sk.because investment distribution in GDP equals(I/GDP ) and marginal product of capital multiplied by capital output ratio equals α. Therefore, we can derive the third equation as shown below
ln y = ln A + α (ln (I/GDP)-ln (n+ g+ δ)) +ε
(1-α)
The above equation, MRW used the specifications to perform an approximation of Solow model concerning the various countries perspective. However, there are some problems encountered when using the above empirical model because of lack of standardised A, that is, technology.
There have been rapid evolution of technology as shown by A (t) = A (0) egt that was assumed to be equal in many countries. Therefore, there is urgency to consider the above assumption to create a regression constant when sampling a country. As a result, i=1…n, whereas c=b+gt.
ln yi = c + α (ln (II/GDPi)-ln (ni+ g+ δ)) +ε
(1-α)
The above equation could be the best suited in studying the economic growth in India because the factors and variables presented are evident in the country at large. The presence of high population could provide the required labour in the different sectors leading to growth of the country’s GDP. On the other hand, technological aspect may be a challenging factor in this country given the need to create job opportunities to the citizens.
Introduction of new technologies would lead to laying of some worker. This may have a negative effect to the labour force because there would be high rate of unemployment. This is a very critical problem seeking a close response by any country, but India must be in frontline to resolve the puzzle on unemployment, and incorporation of new technologies keeping in mind the high rate of population growth.
Theoretically, this empirical model have an augmentation platform because of the presence of contradicting variable that could slow down the rate of income generation to a country hence, affecting the GDP. Various sectors in a country contribute differently to the total GDP. Therefore, it is necessary to pinpoint the major contributor to this GDP so that less or no interference occurs to them.
A wise decision on where to employ technology is crucial to ensure the introduction does not affect the overall productivity of that sector. However, if the introduction of technology can be effective, it is advisable to do it so that the country can maintain or improve the income generation as well as development.
Based on Cobb-Douglas production function, labour, and capital are the major determinant of the total outputs. A proper combination of the two factors is crucial to determine the output. Sometimes it is advisable to dwell on the factor, which is cost-effective and productive. It is advisable to eliminate one of these factors if the results prove positive.
The aspect of opportunity cost becomes very sensitive at this stage and wise decision-making is as well critical. There should be consideration of the Marginal rate to returns so that a country does not dwell on recruiting unproductive labour force in various sectors to minimize on the wages and salaries. Instead, effective use of capital can substitute the labour force through introduction of technology.
However, substitution of labour force in India could remain a challenging decision given the presence of high population in the country. There should be introduction of strategies to address the effective way to introduce technology to complement the high population in the country. The high population should nod serve as a hindrance to technological advancement in the country.
Data analysis on Indian data based on World Bank World Development Indicators (WDI)
This section presented data from WDI to employ various descriptive statistics techniques such as central tendency, distribution, dispersion, histogram, scatter plot, box plot, among others.
Data analysis on indicators for India
India is one country geographically located in south Asia. The population by 2010 was 1,170,938,000 with the GDP totalling $1,727,111,096,363 in the same year. Most of these people have lower middle-income level that implies that the rate of poverty is certainly high. In the same year, the GNI per capita was $ 1,330.
However, the national poverty line has been on decline given that it was 45.3% in 1994 to 37.2% in 2005 as revealed from household surveys. Since 2005, the life expectancy at birth has remained almost constant with the life expectancy improving from 63 years in 2005 to 65 years in 2009.
This could be good indication of future increase in labour force and the population in general. The future of India on relying on cheap labour has a boosting factor from this favourable life expectancy. As long as there is a properly maintained health facilities as currently exhibited, there will be enough labour force. The country can be in a better position to hold the capital factor for other purposes.
On the other hand, the future of effectiveness of labour force is bright as revealed by the improvement of the percentage of the literate adults aging above 15 years. From this age, there is commendable group of working population. Literacy is crucial in comprehending the rules and regulations in workplace as a well as making wise decision following certain commands. When the population is highly educated, the introduction of technology becomes very easy.
India should enjoy this one aspect given that the literacy rate has improved from 41% in 1981 to 63% in 2006. Another encouraging aspect is the low mortality rate currently standing at fewer than five per 1,000. This means that over 99.5% of the newly born children reach an age of five. This country may be owing some foreign bodies such as IMF a 16% debt on the current gross national income (GNI) as revealed in economic policy and external debt.
This should be sending an alarm to the country because the higher it can be, it can be a problem to economic growth. This should be discouraged to ensure the country improve its production to facilitate financing their budget without making any deficits. This will encourage concentration over other national matters instead of working hard to pay back debts.
A large percentage of urban population can access improved sanitation facilities with 54% of urban residents enjoying correctly structured and properly maintained facilities on sewerage. There is good news on employment level because only a 4% of available labour has not secured any job. However, this should be only effective if the marginal rate of returns to capital is increasing. The high employment rate should not be diminishing the rate of returns to capital.
If there is reduction of marginal rate of returns, India should focus on employment of new technologies to boost the current labour force. Private sector, on the other hand, has been a booster to the overall economy with a 31.7% merchandise trade of the GDP. This translates to presence of employment opportunity to unemployed population to reduce the rate of unemployment and improving the living standards of these people (Acemoglu, Johnson and Robinson 2001).
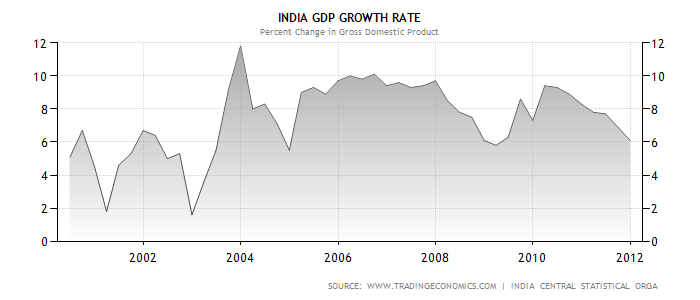
The descriptive data based on the GDP from 1989 to 2009 are shown below

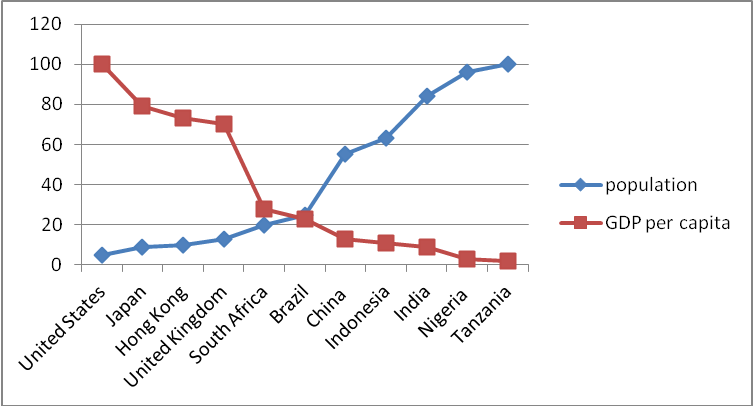
Graph 1: A graph on population against GDP per capita among various countries in the world

Source: World Bank, World Development Indicators, CDROM
Regressions using Microfit 5.0
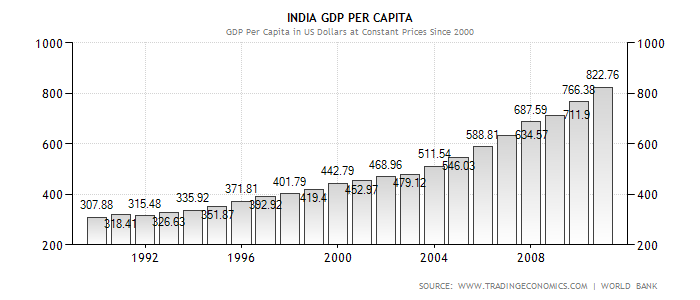
GDP per capita for India adjusted by constant prices from 1990 to 2011

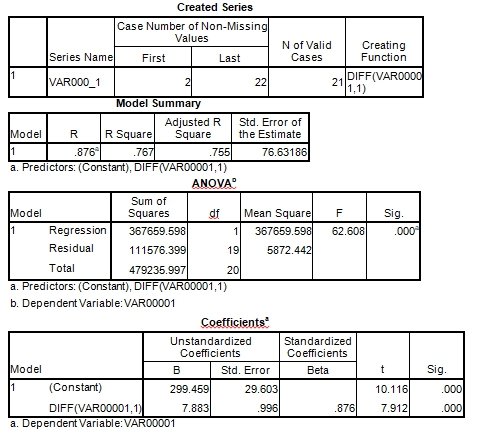
Regression outputs based on GDP per capita

From the above statistics and graphs, it was clear that the GDP have been on the rise in India regardless of the increasingly growing population. This has outweighed the odds that many countries with high population have not been able to fight out. With time, the country is expected to meet its mandate as a country that can cater for its population if this trend is either maintained or improved further.
Reference list
Acemoglu, D., Johnson, S. and Robinson, J.A., 2001. The Colonial Origins of Comparative Development: An Empirical Investigation. American Economic Review, 91(5), pp. 1369-1401.
Easterly, W. and Levine, R., 2001. It’s Not Factor Accumulation: Stylized Facts and
Growth Models. World Bank Economic Review, 15(2), pp. 177-219.
Gujarati, D.N. and Porter, D.C., 1988. Basic Econometrics. New York: McGraw-Hill.
Jones, C.I., 2002. Introduction to Economic Growth. 2nd ed. New York: W. W. Norton.
Klenow, P.J. and Rodriguez-Clare, A., 1997. The Neoclassical Revival in Growth Economics: Has it Gone Too Far? NBER Macroeconomics Annual, 12, pp. 73- 102.
Mankiw, N.G., Romer, D. and Weil, D.N., 1992. A Contribution to the Empirics of Economic Growth. Quarterly Journal of Economics, 107(2), pp. 408-437.