- Allocation of mixed costs between variable and fixed costs
- Changes in cost structure if the volume falls outside a relevant range
- Allocation of direct and indirect costs to similar product lines
- How allocation of costs between variable and fixed help management plan
- Analysis of the Compnet’s financial data
- Reference List
Allocation of mixed costs between variable and fixed costs
Cost behaviour analysis separates mixed costs and allocates them as either fixed or variable costs (Siegel & Shim, 2000). In essence, some costs contain both the fixed and the variable costs and are, thus, referred to as mixed costs. For example, “if the utilities entail a portion of connection fee which is a fixed cost and usage fee which is a variable cost then it becomes a mixed cost” (Albrecht et al.2011).
Examples of mixed costs are sales promotions and factory overheads. To carry business planning analysis through the CVP, “separation is essential to ensure that there is a distinction between variable and fixed costs” (Siegel & Shim, 2000). The least square method is applied to separate the two elements. Variable costs usually change with changes in levels of production in an organization.
On the other hand, fixed costs remain constant even if the levels of production changes. Other methods include use of scatter graph or the high-low method. The low-high formula is easier to separate fixed and variable costs.
Changes in cost structure if the volume falls outside a relevant range
If the volume produced falls outside the range, fixed assets were affected, thus, altering the cost structure. In this case, adjustments are required to maintain the accounting records. For instance, if more units are produced that expected then wage and rent costs (fixed costs) are increased.
Allocation of direct and indirect costs to similar product lines
An organization can allocate direct costs and indirect costs to similar product lines through basis of allocation. According to Albrecht et al. (2011) direct costs are traceable and once traced, they can be assigned to the required product line. On the other hand, indirect costs are hardly traceable and allocated. Direct costs can be saved because of their traceability.
In most cases, direct costs are variable while the indirect costs are fixed which makes it easy to allocate (Albrecht et al.2011). Therefore, through focus on the direct costs, it is easy to determine which segment requires allocation to improve performance.
How allocation of costs between variable and fixed help management plan
It helps an organization to calculate the breakeven point of the organization. With breakeven analysis, an organization can calculate the lowest point where it can produce while still making profits. It also helps in knowing the direction of the organization and calculation of the profits.
Knowing these costs, managers can easily make decisions easily and determine the levels of productions in segments where profits are made. Lastly, knowing the changes in these costs, management can easily allocate the resources in a more appropriate manner.
Analysis of the Compnet’s financial data
Based on the available information, fixed costs will be expected to increase to cover the anticipated production. For instance, the amortization expenses will be $20 million meaning that for the next ten years, each year will be worth this amount.
Since the company is willing to borrow, an interest rate of $3 million will also be added to determine the fixed costs. The full figures are in figure 1. The variable costs are as a result of production which comprise of labour costs, direct material costs, and the variable sales and marketing costs. The total variable costs are presented in the figure 1.
Figure1: Current break-even point for the Prime Component product line
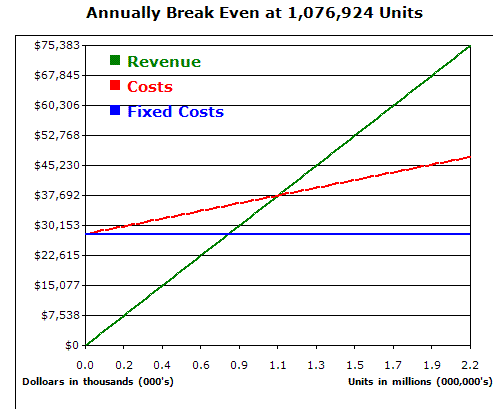
Breakeven point = fixed costs/ (selling price – variable costs)
=$28,000,000/ ($35-$9)
1,076,924 units
Figure 2: Graph of the graph breakeven point for the acquisition

Based on the calculations, upon the acquisitions of the new manufacturing line, the company will be required to produce 1,076, 924 units to cover its costs on annual basis. This implies that the company has to sell at least 1,076, 924 units annually to be able to sustain itself. If it produces more than this anticipated amount then it will make more profits although it will be required to boost labor and other variable costs.
Reference List
Albrecht, W. S. et al. (2011). Accounting, concepts & applications: What, why, how of accounting. Mason, OH: South-Western/Cengage Learning
Siegel, J. G., & Shim, J. K. (2000). Accounting handbook. Hauppauge, N.Y: Barron’s