The Company and Its Ticker Symbol
This discussion analyzes Apple Inc. based on the firm’s success and position in the global technology sector. The company’s ticker symbol is AAPL, which helps to uniquely identify the entity as a publicly traded enterprise and the securities it issues (Yahoo! Finance, n.d.). The ticker sign is an abbreviation using letters acquired from the business’s actual name and identifies Apple’s specific bond or stock on a stock exchange and other financial platforms.
Cash Flow from Operations
Cash flow from operations shows a firm’s cash receipts or expenditures from its daily processes. Apple Inc. realized consecutive growth in this KPI from 2020 through 2022. Stock Analysis on Net (2023) provides the company’s annual cash flow from its activities for 2022, 2021, and 2020 as $122.151 billion, $104.038 billion, and $80.674 billion, correspondingly (Yahoo! Finance, n.d.). Thus, the firm appears to operate efficiently despite the COVID-19 effect, which has affected many firms adversely.
Price-To-Earnings Ratio
The price-to-earnings ratio is calculated by dividing the latest closing price by the latest pay-per-share (EPS). The PE ratio assesses whether a company’s stock trades at the appropriate value. Apple Inc.’s PE ratio for the twelve months ended June 2023 was 29.18, showing that the stock is averagely valued. Generally, Apple realizes a growing trend in the PE ratio element, which proves the corporation’s toughness in the highly competitive market.
Stock Dividends and the Yield
Based on the entity’s returns, stock dividends are the earnings that shareholders receive from a firm’s earnings within a specified time. Apple’s present stock dividend is $0.96, an improvement from 2021’s $0.88 value. Diving the stock dividend with its trading price gives the stock’s dividend yield, whereas Apple’s yield is 0.55% (Yahoo! Finance, n.d.). Consequently, Apple Inc. sustains an above-average stock yield that keeps shareholders satisfied and committed to its success.
Earnings per Share Ratio (EPS)
EPS is a financial quotient acquired by finding an entity’s net income ratio to the total issued mutual shares. The KPI reveals a business’s performance and lucrativeness to potential stockholders deciding whether or not to invest in the firm. Apple’s annual EPS for 2022, 2021, and 2020 were $6.11, $5.61, and $3.28, respectively (Yahoo! Finance, n.d.). The trend shows a growth tendency, meaning shareholders enjoy rising returns over the years.
Revenue Estimates for the Next 12 Months
Revenue estimates inform a company’s budget and help stakeholders work hard to deliver the firm’s goals. The estimates thus depend significantly on previous results and foreseen environmental aspects. Apple has low, average, and high revenue estimates for the year 2023: $116.86B, $123.47B, and $132.94B (Yahoo! Finance, n.d.). The figure compares relatively to previous years’ earnings and is realizable.
Revenue from the Previous 3 Years
Apple realizes a consistently growing trend in annual revenues from 2020 through 2022. For example, the company’s revenues were $394.328B in 2022, a 7.79% rise from 2021. Annual returns for 2021 were $365.817B, while those of 2020 were $274.515B (United States Securities and Exchange Commission, 2023). The figure implies a 33.26% revenue growth between 2021 and 2020. Accordingly, Apple Inc. appears to recover efficiently from the pandemic’s impact.
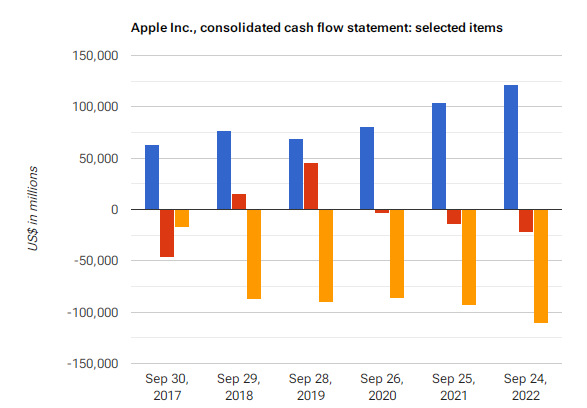
Apple Inc.’s Cash Flows and Net Cash from Operating, Investing, and Financing Activities over the Past 3 Years

Key:
- Cash generated by operations.
- Cash (used) generated by investing activities.
- Cash used in financing activities.
Apple’s 2022 cash flow and net cash from operating activities.
Apple’s 2022 cash flow and net cash from investing activities.
Apple’s 2022 cash flow and net cash from financing activities.
Based on the above results, Apple’s cash flow growth correlates with a rise in cash expenditure in investing and financing activities.
References
Stock Analysis on Net. (2023). Apple Inc. (NASDAQ: AAPL): Cash Flow Statement. Web.
United States Securities and Exchange Commission. Apple Inc. (2023). Form 10-K: Apple Inc. Web.
Yahoo! Finance. (n.d.). Apple Inc. (AAPL). Web.