Introduction
Appropriation and expense trends significantly reduce the probability of governments having many debts. It ensures that governments maintain annual expenses are lower than annual revenues (Gore & Clinton, 2019). The process also finds varied funding sources that project appropriate amounts and capital cash in hand. This projection thus ensures proper funding that lasts through budget cycles (Mikesell, 2018).
Security governance’s primary is risk precaution, national security, or homeland resilience. Congress makes appropriations to determine the expenditure of the funds during the budget cycle. Allocation and determination of appropriations are done before the outset of budget years. However, there is a variation in expenses based on fixed costs. This paper will analyze trends for the years 2015, 2016, and 2017 of the United States (U.S) Department of Transportation Security Administration (CAS-TSA), Homeland Security’s Total Budget Authority, U.S Coast Guard, and U.S Immigration and Customs Enforcement (CAS-ICE). It will also give an analysis of the expenses for 2015, 2016, and 2017 of the U.S Homeland Security’s Transportation Security Administration (CAS-TSA). The presented data is subject to conversion to 2020 dollars using the U.S Inflation Calculator.
The trend analysis has shown minimal growth in the budget of homeland securities. The new informational age has made it impossible to meet demands due to increased costly environments when assessing annual budgets (Petersen & Tjalve, 2013). Budget managers can be encouraged by Proverbs 3:21 New International Version (NIV). The scripture says, “My son, do not let wisdom and understanding out of your sight; preserve sound judgment and discretion.” Budget managers, therefore, will be besieged to deploy wisdom when developing a budget and maintaining the daily demands of society’s expectations. Homeland security is the primary dealer in border security, cybersecurity, immigration enforcement, response and preparedness, disaster recovery, front-line personnel, aviation assets, and critical maritime.
Appropriation Indicators
Total Budget Authority
- Warning Trend: Decrease as a percent of U.S. Department of Homeland Security Appropriations allocation to Total Budget Authority.
- Description: a decrease in the percentage of U.S Department of Homeland Security Allocated appropriations to U.S Immigration and Customs Enforcement may inconvenience the Homeland Security Agency in enhancing levels of its service provision. However, new revenue sources that trim expenses will serve to avert the service shutdown risk.
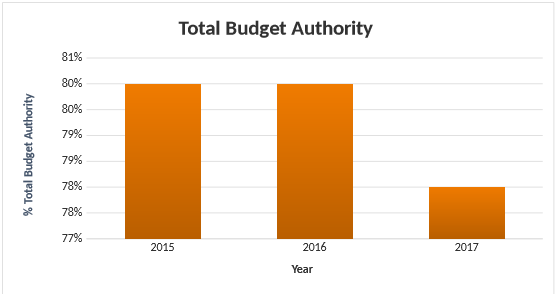
Appropriation of the Total Budget Authority is subject to the U.S Transportation Security Administration, the U.S Immigration and Customs Enforcement, and Coast Guard. According to Homeland Security 2017, the U.S Coast Guard receives the highest appropriation, with $10 million more allocated between 2015 and 2017. The Total Budget Authority experienced a 2% increase from 2016 to 2017. Even though there was a rise in the appropriation of the definite Total Budget Authority each year, 2017 had 78%, while Gross Discretionary Budget Authority was considered as in chart 1.
Professionals in the governmental budget will evaluate trimming expenses due to the observed decrease in the Total Budget Authority (Rivlin, 2012). There is a forecasted gap in the expenses and appropriations. However, the gap is declining slowly from 2015 to 2017. The 2015 to 2017 trends show the slight fluctuation of the Gross Discretionary Budget Authority, while the Total Budget Authority has remained fairly constant. Thus, the trend analysis basis has not determined significant changes.
U.S Immigration and Customs Enforcement (CAS-ICE)
- Warning Trend: Decreasing appropriations as present of U.S Department of Homeland Security Appropriations allocated to U.S Immigration and Customs Enforcement.
- Description: a decrease in the percentage of U.S Department of Homeland Security Appropriations allocation to U.S Immigration and Customs Enforcement may inconvenience the Homeland Security Agency in providing effective services.
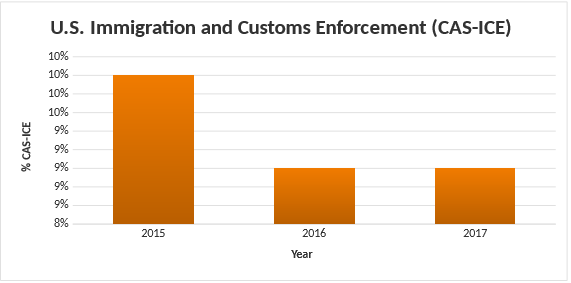
2015, 2016, and 2017 trends show that the U.S Immigration and Customs Enforcement (CAS-ICE) had a marginal decrease in 2015 and 2016. It had a constant percentage in 2016 out of the total budget in 2017. The percentage of the total budget was 9% in 2016 and 2017 and 19% in 2015. Therefore, there can be an indication of the cut-back marginal of the budget allocated to the U.S Immigration and Customs Enforcement (CAS-ICE) in 2015 and 2016. The warning trend showcased a percentage decrease in the marginal allocation of the Total Budget Authority from the 2015, 2016, and 2017 fiscal years. For this reason, a decrease in the budget would have led to the U.S Homeland Security’s disability to finish existing services levels effectively using a smaller budget allocation.
The U.S Immigration and Customs Enforcement (CAS-ICE) budget play an essential role in guarding Americans against crime and illegal immigration. CAS-ICE abides by the duties and obligations of Homeland Security to ensure public safety. The U.S CAS-ICE is the operator of the largest detention system for immigrants globally (Irvine, 2020). For this reason, CAS-ICE is mandated to detain aliens that get unauthorized immigrations into the U.S (Varan, 2018).
The trend analysis appropriates the CAS-ICE for more than $6 million. 2017 was the year with the highest allocation as of three years’ comparisons. There is a minimal decreasing trend; however, there is a need for adjustment in the budget to maintain an upward direction trend. Chart 2 showcases 9-10% CAS-ICE appropriations across a trend in 2015. The Total Budget Authority shows that support and operations budgets take the greatest portion of the U.S CAS-ICE budget (Homeland Security, 2017). This budget encompasses administration and management, agency investigation, elimination and implementation, and the principal legal advisor’s office.
Transportation Security Administration (CAS-TSA)
- Warning Trend: Percentage decrease in appropriations of U.S Department of Homeland Security Appropriations allocation to Transportation Security Administration.
- Description: The percentage decrease in the U.S Department of Homeland Security Appropriations allocated to the Transportation Security Administration may inconvenience Homeland Security’s ability to enhance its services until new revenue sources that trim expenses are implemented.
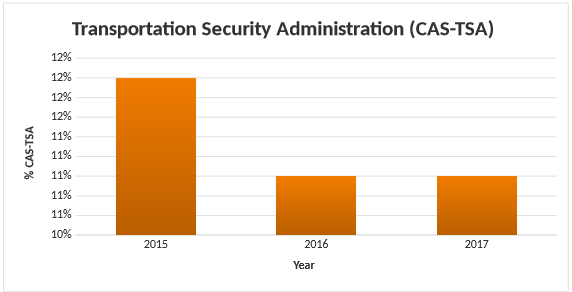
The marginal percentage decrease in the total budget resulted in a downward trend in Transportation Security Administration (CAS-TSA) from 2015-2016 until 2017. The warning trend displays a borderline decrease in the percentage allocation of the budget of the Total Budget Authority in 2015, 2016, and 2017. Therefore, the decreased budget is an inconvenience to Homeland Security to complete its operations in the U.S with a reduced budget.
The Transportation Security Administration (CAS-TSA) was formerly a sector under the transportation sector. The 911 terror attack incident made TSA be relocated under Homeland Security (Mlepo, 2022). CAS-TSA has become the primary controller of air cargo screening, roles in rails, employee background checks, port and maritime security, and urban transit (Mlepo, 2022). Appropriation for the CAS-TAS budget is estimated at more than $ 7 million from the Homeland Security budget. Support and operation take the largest allocation of CAS-TAS budget, specifically in the screening and transportation operation. According to Mlepo 2022, labor and screening are covered in screening and transportation operations. Comparison to the total budget range from 11% to 12% of the total budget between 2015 and 2017. This trend to the budget comparison is illustrated in chart 3.
The U.S Guard Coast
- Warning Trend: Decreasing appropriations as a percent of U.S Department of Homeland Security Appropriations allocated to the U.S Coast Guard.
- Description: A percentage decrease in the appropriations of the U.S Department of Homeland Security allocation to the U.S Coast Guard may limit the department’s ability to provide its services without deployment of new revenue sources that will trim expenses.
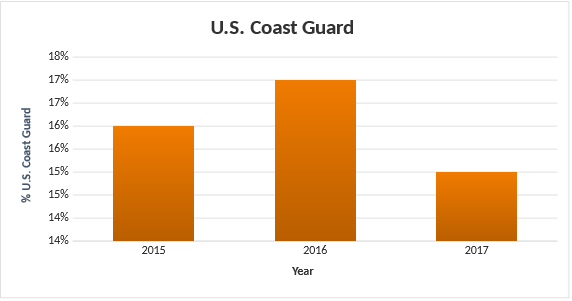
There was an upward marginal trend in the U.S Coast Guard budget. This budget is expressed as a percent of the Total Budget, which marginally increased between 2015 (16%) and 2016 (17%). An increase in the budget during 2016 promoted a higher level of services by the agency. However, the department exhibited a downward budget trend from 17% to 15% between 2016 and 2017. The warning trend decrease in the budget in 2015, 2016, and 2017 would substantially affect the Homeland Security department to provide its services with a smaller budget.
The U.S Coast Guard comprises military forces whose main duty is to protect coastal regions, water, ports, and shore. According to Homeland Security 2017, the Coast Guards are responsive to terrorizations and enhance the security of rescue missions and shipping systems while combating terrorism (Meyers, 2014). The U.S Coast Guard is mandated to respond to unexpected occasions that cause national crises like the 1989 Exxon oil spill, Hurricane Sandy in 2012, and the 2005 hurricane Katrina (Sanial, 2014). The Coast Guard plays a significant role in times of disasters in the U.S.
Based on uncertainties that might occur. The U.S Coast Guard budget fluctuated more than other departments in Homeland Security from 2015 to 2017. 2017 had 15% as the lowermost budget of the three years. There was a further drop of 2% in 2016 and 2017, as shown in chart 4. Past events are used to predict the U.S Coast Guard annual budget. Thus, these events call for organizational leaders to continue preparing and reacting to improbable and seemingly uncertainties in an environment characterized by complex theories and chaos (Sanial, 2014). Preparation is part of allocating a sufficient budget that will cover disasters whenever they occur.
The NIV scripture by Luke 12:35 states, “we should be dressed and prepared for service and maintain our lamps burning.” This verse prompts different faiths to remain on their toes because of the untimely and unpredictable tragedies. Terrorist attacks are unpredictable, and hurricanes can build at an unexpected time. Therefore, the U.S Coast Guard needs to prepare to handle any uncertainty, while the government should provide the equipment and funds required to achieve efficient preparation.
Expense Indicators
Four Largest Departmental Expenses for Transportation Security Administration (CAS-TSA)
- Warning Trend: Comparison of decrease as a percent in the TSA’s Expense Areas of U.S. Department of Homeland Security Appropriations.
- Description: A reduction in TSA’s Expense Areas as a percent of TSA Budget may hinder the Homeland department’s ability to sustain its services if new revenue sources are not incepted.
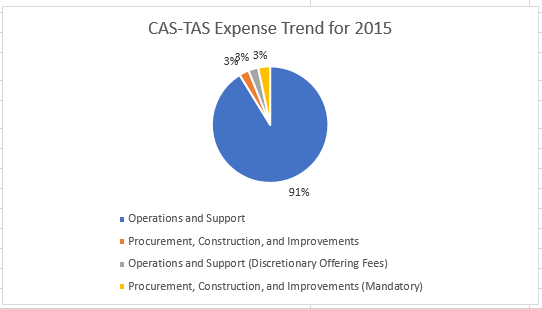
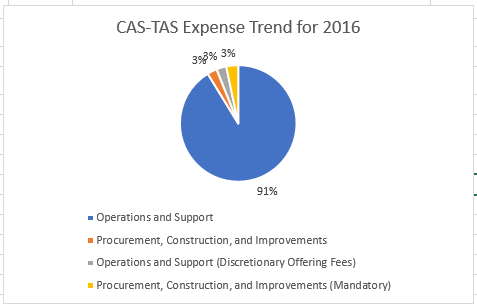
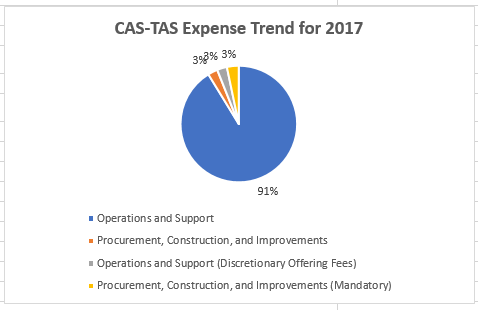
The major expense for Transportation Security Administration includes procurement, operations and support, and construction and improvements. Discretion offering fees, construction, improvement, and procurement constitute mandatory fees. This section will complete a trend analysis for the CAS-TSA expense for 2015, 2016, and 2017.
Charts for the fiscal years 2015 and 2016 show that the percent of the Total TSA budget allocation to construction and improvement and procurement expenses had a marginal increase of 2.69% in 2016 from 2.43% in 2015. These values suggest additional procurement, construction, and improvement funding in 2016. Construction and improvement expenses increased from 2.69% to 2.72% in 2016 and 2017, respectively, despite an overall decrease in the TSA budget to $8002192 from $8012011. Thus, this change signifies an upward trend without warning in procurement and construction and improvement expenses in 2016 and 2017.
The total allocation to Discretion Offering Fees Expenses experienced a decrease from 2.92% in 2015 to 2.61% in the 2016 fiscal year. This decrease expresses the capability of the U.S Homeland Security department to maintain its services despite a decrease in the overall TSA budget (Austin, 2021). However, there was a marginal increase from 2016 to 2017 from 2.61% to 2.74%. The upward trend warning in Operation and Support expenses between 2016 and 2017 enabled the U.S Homeland Security Agency to fulfill the current service efficiently.
Mandatory expenses experienced a marginal decrease from 3.40% in 2015 to 3.36% in 2016. Thus, the mandatory expenses were allocated a reduced amount of funding in 2016 than in 2015. A descending trend was exhibited from 2016 to 2017 due to a marginal decrease of 0.06% in 2017. This constant reduction in fund allocation showcased Homeland Security’s ability to sustain existing service provision and distress its general activities.
There was a percentage increase in the Total TSA budget allocated to Operations and Support Expenses to 91.34% from 91.25% in 2016 and 2015, respectively. Thus, an ascending trend was exhibited without warning as a result of the increased percentage of the total TSA budget. 2017 experienced a plunge in allocation for Operations and Support Expense of the Total TSA from 91.34% to 91.24% in 2016 and 2015, respectively. For this reason, a downward trend indicated a warning in the trend analysis of Operations and Support Expenses in 2016 and 2017.
Thus, the reduced budget inconvenienced the fulfillment of service provisions in the agency. Jeremiah 29:111 notes, “God knows that plans he has for his people, plans of prosperity, hope and future, and not harm.” Thus, this scripture encourages people to have a plan for anything since God has plans for everyone. Therefore, budgeting is subject to a well design, plan, and thought to effectively meet the fulfillment and execution of services (Rubin, 2008). The budget would therefore serve as an instrument for administrative legislation and control.
Conclusion
This report analyzed the projected expenses and appropriations by the U.S Homeland Security during 2015, 2016, and 2017 across the Transportation Security Administration, the Total Budget Authority, the U.S Coast Guard, and the U.S Immigrations and Customs Enforcement. The report shows that expenses and appropriations should not be relative to certain departments and organizations. Due to numerous variables, it is complex to correlate total budgetary authority over a given period. These variables are broad because they include the creation of additional allocations for uncertainty departments for funding. Thus, negligible warning marks exist that replicate the probability of some fiscal health that Homeland Security soon can face. Generally, the warning trend component will help the agency to measure probable inflation and predict fitting appropriations in the future to run each department’s operations effectively.
References
Austin, A. D. (2021). The Debt Limit Since 2011. FAS Project on Government Secrecy (1991-2021). Web.
Gore, A. I., Clinton, B., & National Performance Review Staff Paperback. (2019). From red tape to results: Creating a Government That Works Better and Costs Less. Google Books. Web.
Homeland Security. (2022). Congressional budget justification F.Y. 2017. Web.
Irvine, M., Coombs, D., Julianne, S., Rich, J., Faye, T., & Green, T. C. (2020). Modeling COVID-19 and its impacts on U.S. immigration and customs enforcement (ICE) detention facilities, 2020. (2020). PubMed Central (PMC). Web.
Meyers, R. (2014). The Implosion of the Federal Budget Process: Triggers, Commissions, Cliffs, Sequesters, Debt Ceilings, and Shutdown. Public Financial Publications Inc. Web.
Mikesell, J. L. (2018). Fiscal administration: analysis and applications for the public sector. (10th ed). Boston, MA: Cengage Learning. ISBN: 9781305953680. Chapter 15
Mlepo, A. T. (2022). Attacks on road-freight transporters: a threat to trade participation for landlocked countries in Southern Africa. Journal of Transportation Security, 15(1), 23-40.
New international version (NIV) – Version information – BibleGateway.com. (n.d.). BibleGateway.com: A searchable online Bible in over 150 versions and 50 languages. Web.
Petersen, L. K., & Tjalve, V. S. (2013). (Neo) republican security governance? U.S. Homeland Security and the politics of “Shared responsibility”. OUP Academic. Web.
Rivlin, A. M. (2012). Rescuing the Budget Process. Wiley Online Library. Web.
Rubin, I. S. (2008). Public budgeting: Policy, process and politics. Routledge & CRC Press. Web.
Sanial, G. (2020). Exploring U.S. coast guard organizational preparedness through chaos and complexity theories Πemergence: Complexity and organization. Semantic Scholar | AI-Powered Research Tool. Web.
Thomas, P., & Lauth. (2021). Public budgeting in Georgia: Institutions, process, politics and policy | Lauth, Thomas P. | download. Electronic library. Download books free. Finding books. Web.
Varan, A. K., Lederman, E. R., Stous, S. S., Elson, D., Freiman, J. L., Marin, M., Lopez, A. S., Stauffer, W. M., Joseph, R. H., & Waterman, S. H. (2018). Serological susceptibility to varicella among U.S. Immigration and Customs Enforcement Detainees. Journal of Correctional Health Care, 24(1), 84–95. Web.