Introduction
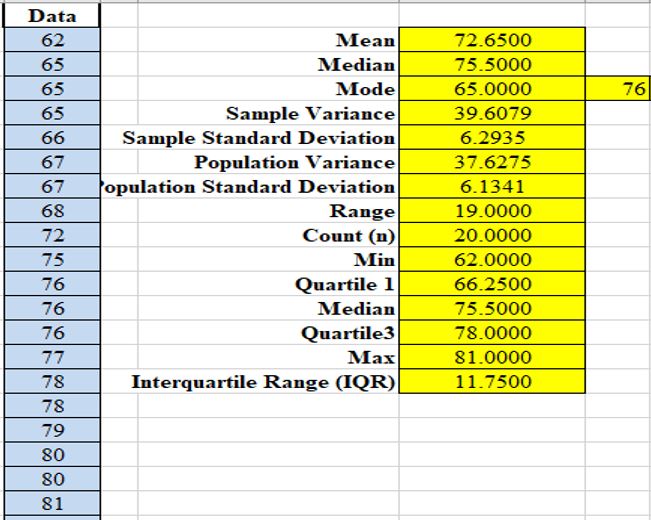
- The mean for the heights is 72.6500
- The standard deviation is 6.2935

According to the mean value of the heights from the survey, as indicated in (fig.1) above, I am more than the average since my height is 74.65. Therefore, it means I am taller than most of the people whose heights were surveyed by this study.
Step 2: Background Information
To choose the participants of the study, the sampling method was used to represent the entire population. Clustered sampling was the appropriate method that was suitable to have a logical representation for the group used for the study. The population was divided into smaller sections called clusters (Haq, 2017). The study took place in several parts of the US, namely Portland, Stowe San Diego, Tao, and New York.
The age range that the study mainly focused on was 17 years minimum, and the maximum number of years was 50. The reason why the range was considered to be perfect for the study is due to biological developments and normal human growth (Gatto, 2019). Out of ten participants who were randomly picked from the study’s clusters, 6 were men, while 4 were women. In terms of percentages, male individuals represented 60% of the total number of persons involved in the final analysis while women took the remaining 40%. The interesting thing about the group is that men were taller than women to the extent of 20 inches in terms of difference (Light, 2016). Women were less willing as compared to their male counterparts hence subjecting the research to more men contributors.
Step 3: The Empirical Rule
In the study, as shown in (fig.2) below, the empirical rule, the lowest numbers for 68%, 95%, and 99.7% were 61.3, 48.3, and 35.3, respectively. The upper numbers for 68%, 95%, and 99.7%, as shown in the figure below, were 78.94, 85.24, and 91.53 in that order. The values tell the researcher that the three-sigma rule has a normal distribution. (Kim & Oh, 2016). Therefore, in this study, the cumulative distribution of the figures is strong, and that depicts a standard score in the results derived.

Based on the study results as shown in (fig. 3) below, the percent of study participants shorter than me is 62.47%, the percent of participants taller than me is 37.53%.

References
Gatto, R. (2019). Saddle point approximation for data in simplices: a review with new applications.Stats, 2(1), 121-147. Web.
Haq, A. (2017). Two-stage cluster sampling with hybrid ranked set sampling in the secondary sampling frame. Communications In Statistics – Theory and Methods, 46(17), 8450-8467. Web.
Kim, D., & Oh, H. (2016). Empirical mode decomposition with missing values.Springerplus, 5(1). Web.
Light, R. (2016). How to conduct pleural research: master’s advice. Turkish Thoracic Journal, 17(3), 114-117. Web.