Introduction
Baseball, as a sport, continues being a favorite sport among Americans. There has been a gradual increase in average salaries paid to baseball players in Major Baseball League (MBL). Data of three selected teams (NY Yankees, LA Dodgers, and NY Mets) provides an analysis of team performance during the years (2002-2010) in relation to salaries offered.
Descriptive Statistics
To understand clearly the relationship between variables that are prerequisites for team performance, a measure of central tendency (mean) and measures of dispersion (standard deviation) and Skew are used in the discussion of results.
Skew
Skew in a frequency distribution shows to which side a variable under study occurs. A positive skewed value shows that distribution is rightly tailed and verse versus. Left skewed value shows that the variable under investigation is closer to its maximum value than a right-skewed value, which shows closeness to the minimum variable value. Descriptive statistics can quickly give the overall trend of a variable within specified intervals.
Standard deviation
The use of standard deviation as a measure of disparity among salaries paid to players provides an effective variable than average salary as it gives a direct insight on performance attributed to a specific team (Sato, 1997).
Results discussion
Annual Salaries offered to players
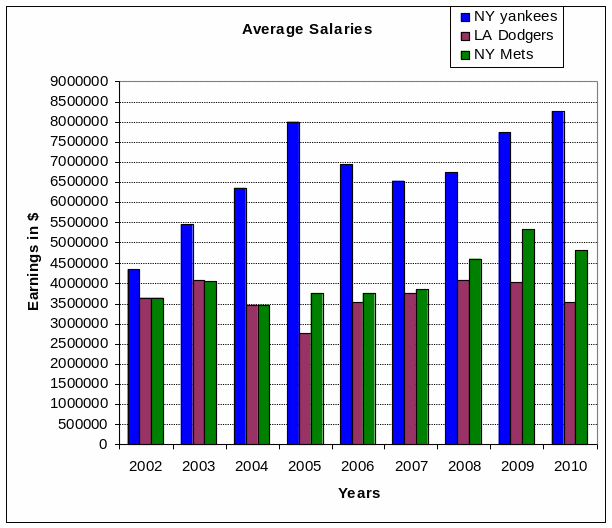
NY Yankees had the highest average salary paid to players at $ 6,710,945 in a season. This is 1.8 and 1.6 times higher than average salary paid to players in LA Dodgers and NY Mets, respectively, figure 1. Standard deviation values in salaries stood highest in New York Mets at $1,252,571 per annum, translating to be factors of 3 and 1.9 higher to that attributed to LA Dodgers and NY Yankees, respectively.
Table 1 does show that, indeed, the most successful team, NY Yankees. Over the period have offered a significantly average salary to their players, almost six times compared to the industry value of $ 1,850,000 (Depken,2000) as such being successful NY Yankees have kept low standard deviation in salaries offered to their players relative to their own average salary.
Large discrepancies, as expected in NY Mets, had a negative effect on the overall team performance as some players feel more appreciated than others. Skew values to average salaries of LA Dodgers players stood at -1.01 with NY Yankees at -0.68 and NY Mets at 0.99. This implied that mean salaries offered to LA Dodgers were less than the median salary offered by a factor of 101% with NY Yankees at 68%. The Mean salary of NY Mets was higher than their median salary by a factor of 9.9%. This meant that the salaries of LA Dodgers players were evenly distributed relative to average salary with above-average distribution in NY Yankees and a weak distribution in NY Mets. This distribution has an impact on overall performance (Scully, 1974).
Team Support from fans
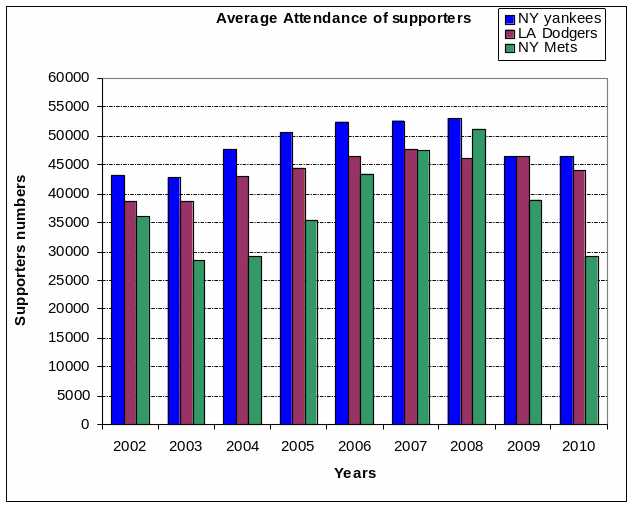
NY Yankees had the highest average number of fans attending their matches, as depicted by home matches averaging at 48,385 supporters annually. This fan-based support in comparison to the other two teams is higher by a factor 1.1 and 1.3 times to fan attendance by LA Dodgers and NY Mets, respectively. A large standard deviation in attendance by NY Mets supporters is undoing to the overall revenue to the team averaging to 8,359 supporters annually. This accounted for 2.1 and 2.5 times more disparity to NY Yankees and LA Dodgers, respectively, table 1 and figure 2.This big disparity in support attendance means there exists a big variance in revenue accrued by the club from its supporters.
With unclear revenue base, NY Mets cannot afford large salaries to players hence their unstable performance. The level of supporters in a population to a team impacts positively on the overall performance (Burger and Walters, 2003). Indeed a large number of supporters’ results to big revenues collected, changes to high salaries paid to players with a net effect of good performance. The skew values for average fan support were highly negative to LA Dodgers at -0.9 with NY Yankees at -0.167 and NY Mets at 0.43. This implied that LA Dodgers fans had the highest attendance as the support was very close to the average support, followed by NY Yankees with least attendance to average occurring in NY Mets. The skew values show the inclination to the overall average attendance.
Table 1. Comparative descriptive statistics between NY Yankees and LA Dodgers


An effective measure of descriptive statistics
The use of histograms in descriptive data presentation is preferred over the use of skew values. There is a greater understanding in analyzing changes within a variable under discussion over a given period by the use of graphical works as compared to individual score values represented by skew values. It is easier to appreciate trends like average salaries paid to players over the period with greater emphasis on increasing and decreasing patterns.
By the use of a histogram on NY Yankee’s average salaries, we can figure out that between the years 2002 to 2005 there was a positive increase pattern whereas between the years 2006 to 2007 there was a decreasing pattern. Skew values give the direction of variance in a frequency distribution curve, notwithstanding they lack capacity in helping to comprehend quickly trends of variables that are well met by the use of histograms.
Conclusion. Future trends to salaries offered to players
Analyzing data from teams participating in Major league baseball agrees strongly with the research objectives. There is a positive relationship between supporters’ attendance to games to higher salaries translating to better performances. Supporters’ attendance is critical in overall revenue accrued by the club, forming a strong financial base. Levels of standard deviation in player salaries seem not to affect team performance as the most successful teams have great standard deviations in salaries to players. This can be attributed to higher average salaries to players in these teams compared to others. This study determines that team performance is positively correlated to salaries offered players (DeBrock et al., 2004).
It must be known that to predict clearly the salaries offered to players in the Major Baseball League; there is a needed use of a mathematical model. This is true to the fact that a lot of variables related needs to be factored in analysis. Nevertheless, the use of descriptive statistics paints a quick picture of the various trends in the multi-billion sports industry. Lastly, increasing trends in salaries payable to players will continue positively in the future because there is a great urge to invest in the sport in the form of advertisements and contracts, which will reflect on team performances.
References
Burger, J.D. and Walters, S.J.K. (2003). “Market Size, Pay and Performance”. Journal of Sports Economics, Vol. 4 (2), 108-125.
DeBrock, L. and Koenker, R. (2004). “Pay and Performance: The Impact of Salary Distribution on Firm-Level Outcomes in Baseball”. Journal of Sports Economics, Vol. 5 (3), 243-261.
Depken, C.A. (2000). “Wage Disparity and Team Productivity: Evidence from Major League Baseball,” Economics Letters, Vol.67, 87-92.
Fans attendance. Web.
Salaries. Web.
Sato, M. (1997). Some remarks on Mean, Median, Mode and Skewness. Australian Journal of Statistics, Vol. 39 (2), 219-224.
Scully, G.W. (1974). “Pay and Performance in Major League Baseball,” The American Economic Review, Vol.64 (6), 915-930.