The rationale for the Selected Visuals
As the purpose of the project consists in analyzing various belief systems pursued by Generation X and Millennials (Generation Y), it is purposeful to represent photos, statistics, and graphs uncovering the percentage characteristics in terms of the population sample attitude toward marriage, parenthood, education, and habits. The first visual reveals the clothing style and appearance of the identified groups, which allows understanding their affiliation with traditions. In this respect, Generation X representatives prefer wearing classic clothing whereas Millennials choose a casual style, which is more preferable for their lifestyle. The conservative and liberal views, therefore, are expressed not only through their clothing but also through their attitudes to life. Therefore, appearance reveals important information about these two groups. The psychological portrait of this group is also possible to define by looking at the photo.
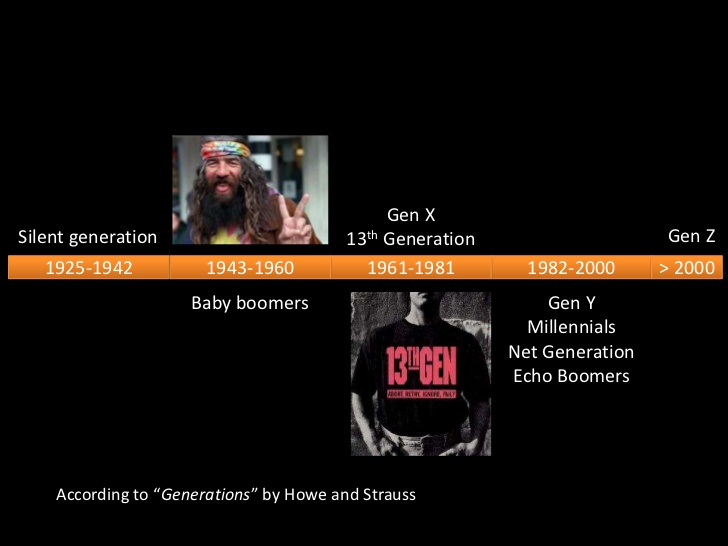
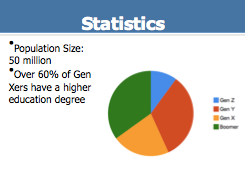
The second visual allows the audience to understand the timeframes to which both generations belong. In particular, the presented timeline allows to predict future generations’ tastes and habits and provide the target audience with a better idea of age categories of both groups under consideration. The last three visuals represent statistics and charts related to the habits, attitudes, and beliefs of Generation X and Millennials. Specific attention has been given to their outlooks on marriage, education eating habits, parenthood, and use of technological devices. Interestingly, the pie chart representing the percentage ratio of generations that obtain higher education demonstrates that generations’ engagement in gaining degrees is nearly equal. However, the statistics also show that Generation Z is still less interested in such values as marriage and parenthood.
Intended Audience
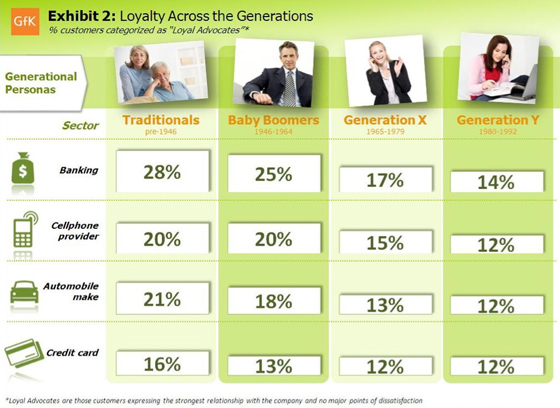
The target audience can involve the age category from 18 to 30 years. The type of generation highlights the differences that exist between their generation and the previous one. In such a way, this project aims to define strategies, recommendations, and approaches to fill in the gap between the two age groups, as well as predict what problems can occur to them. The information, however, will also be useful for Generation X to learn new facts about Millennials and find out what could be done to improve communication. For instance, the last chart demonstrates that Millennials are less committed to old-fashioned devices because they are in constant pursuit of innovative technologies. In contrast, Generation X representatives are more attached to old traditions and, therefore, quality is of primary importance for them.
Expected Results
The visuals represent pathos, ethos, and logos and, therefore, they will provide a multifaceted vision of the two generations. In particular, visual information, or pathos, can present the audience with the impression and emotional filling of the representatives of both groups whereas statistical data and timeline refers to logos and allow the audience to gain a better understanding of how both generations could be treated in terms of their attitude to ethical, practical, and spiritual values.
Such an approach to representing the main characteristics of the two generations introduces a wider picture of their beliefs, spirituality, and attitude to life. Focus on concrete details, therefore, permits forming generalized assumptions and predict further changes in generations’ thinking. More importantly, it will allow defining similar features that create the bridge between Millennials and their predecessors.


Visual 3: Statistics.

