Introduction
A person’s weight and height are used to determine their BMI (Body Mass Index). Alternatively, the BMI may be calculated by dividing the weight of an individual by the square root of their height, with the result reported in kilograms per square meter (Sullivan, 2017). Individuals are assigned to one of four weight categories based on their BMI scores: “normal weight,” “overweight,” or “obesity.” BMI has become an issue in today’s society as a result of the rapid development of lifestyle illnesses. Over 25 and under 20 are considered unhealthy BMIs, which contribute to a high death rate in today’s culture (Maryclaire, 2020). BMI measurements that are too low or too high might be caused by a variety of circumstances in our daily lives. For us to avoid becoming victims of the extreme in society, we need to grasp the elements that influence BMI. Therefore, this research will critically examine the link between BMI and patient characteristics based on the Framingham Heart Study dataset.
Hypothesis
Using the following hypothesis, the data collected may be analyzed.
- H0: In the Framingham Heart Study, there is no correlation between BMI and patient characteristics. (Null hypothesis)
- H1: In the Framingham Heart Study, BMI was shown to be correlated with patient characteristics. (Alternative Hypothesis)
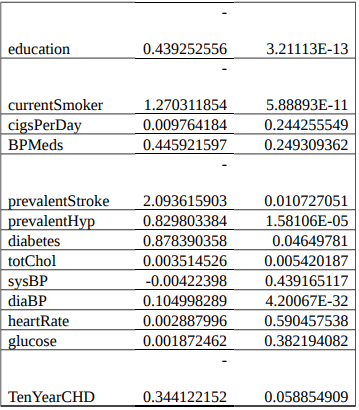
Results of ANOVA Multivariate Analysis


Discussion
- It was shown that an effect size of p-value 3.21703 E-09 might be attributed to patients’ gender. Given that it is less than 0.05, we are forced to accept the null hypothesis and rule out all possibilities of a significant effect. As a result, BMI has no bearing on a patient’s gender.
- Additionally, the p-value for age was 0.773380806, which was higher than 0.05. We reject the null hypothesis in light of these findings and adopt the alternative hypothesis. There is a direct correlation between a patient’s BMI and his or her age.
- This study found that the p-value for education was 3.21113E-13, which is less than 0.05. There was no correlation between patients’ BMI and their level of education as shown by the p-value analysis.
The p-value for the following variables is lower than 0.05: smoking prevalence, stroke prevalence, hypertension prevalence, diabetes prevalence, cholesterol prevalence, and the prevalence of 10-year-old children. However, the BMI of patients is not correlated with any of the above mentioned variables. Cigarettes per day, blood pressure, heart rate, glucose level, and the age of ten-year-old are all features with a p-value more than 0.05 that are not included in this study. As a result, BMI and the presence of these characteristics are linked in patients.
According to the presented dataset, there is no connection between multivariate and crude implications. The statistical method used in the analysis may have contributed to the discrepancies. With the aid of this tool, one can clearly see the distinction between the two impacts (Heinrich et al., 2016). In addition, there are other factors that have nothing to do with BMI or the factors that cause the wide range of results to be seen. This is why there is a wide range of results in terms of the variety.
Conclusion
In conclusion, not all traits are connected to BMI, as has been stated previously in this essay. Age, the number of cigarettes smoked each day, blood pressure, heart rate, and blood glucose levels all had an effect on BMI. However, BMI is not directly associated with gender, education level, smoking, stroke, hypertension, and cholesterol levels.
References
Heinrich, S., Kowalsky, U., & Dinkler, D. (2016). Multiscale Damage Analyis for Steel Structures.PAMM, 16(1), 133-134. Web.
Maryclaire, N. (2020). WHO Categories of Manual BMI, Standard Scan BMI, and Straight Scan BMI. Web.
Sullivan, L. M. (2017). Essentials of Biostatistics in Public Health. Jones & Bartlett Learning.