The purpose of this report is to determine the optimal pH of the enzyme invertase, compare the amounts of sucrose in three beers, and create a protein purification table. Carbohydrates are grouped into four classes based on their chemical configuration: monosaccharides, disaccharides, oligosaccharides, and polysaccharides (Tymoczko et al., 2019). The most common disaccharide is sucrose, which is made by joining of glucose and fructose (monosaccharides) via an alpha 1-4 glycosidic linkage. This bond can be cleaved through the enzymatic action of invertase in the presence of water to liberate equimolar concentrations of glucose and fructose. Glucose and fructose are reducing sugars due to the presence of free aldehyde and ketone functional groups, which can be detected using the 3,5-Dinitrosalicyclic Acid (DNS) Assay. Reducing sugars form a red-brown color with DNS whose original color is yellow. The extent of color formation can be used to quantify the activity of invertase.
Invertase has industrial applications such as the sweetening of substances in the food and beverage sectors. Being an enzyme, its activity is affected by factors such as temperature, pH, substrate concentration, and product concentration. Furthermore, biotechnological advances have made it possible to obtain pure forms of the enzyme from cultured transgenic bacteria engineered to produce the enzyme (Bhalla et al., 2017). Therefore, several protein purification techniques such as salt fractionation, ion-exchange chromatography, molecular exclusion chromatography, and affinity chromatography can be used to obtain a pure version of the protein from cell lysate. The key findings were that the optimum pH for invertase was 5. Beer 3 had the highest concentration of sucrose at 15.25 mM, whereas the percentage yield of invertase was 112.50%, representing a 48.94 purification level.
Results
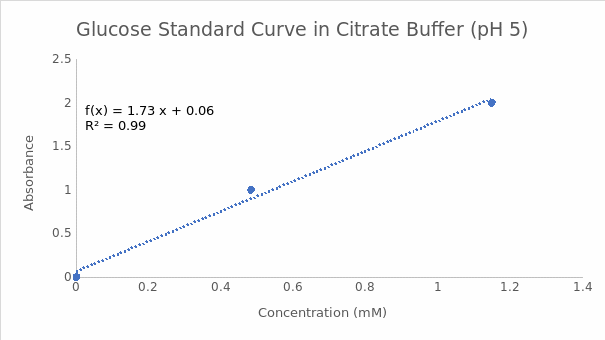
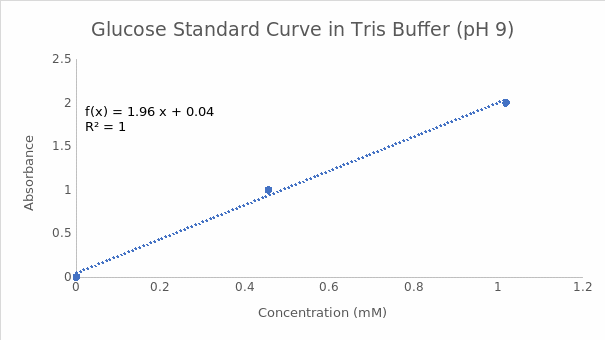
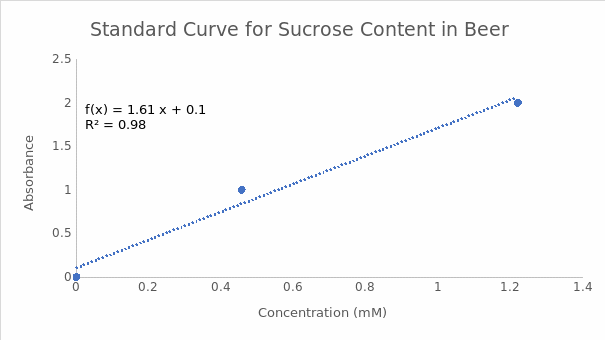
The endpoint of the enzymatic reactions involving a reducing sugar and DNS in the experiment was indicated by the formation of a red-brown precipitate in the positive controls (tubes containing glucose). Tube 5a with citrate buffer at pH 5 had a higher A540 value than tube 10a with tris buffer at pH 9. Therefore, the optimum pH for invertase was 5. These findings are summarized in Table 1. Figures 1 and 2 indicate the reducing sugar standard curves for glucose at pH 5 and 9, respectively. A separate standard curve (Figure 3) was developed to estimate the concentrations of sucrose in 3 beers, namely Pilsner (beer 1), Banana Bread Beer (beer 2), and Ginger Beer (beer 3). The outcomes in Table 2 show that beer 3 had the highest concentration of sucrose at 0.67 mM, followed by beer 2 at 0.10 mM, and beer 1 at 0.09 mM. However, these concentrations were adjusted based on the dilution factor of 1:25, which resulted in final sucrose concentrations of 16.75 mM, 2.5 mM, and 2.25 mM for beers 3, 2, and 1, in that order.
Table 3 indicates the protein purification outcomes for invertase from cell lysate by affinity chromatography. The total protein content in milligrams was 31.1 mg for the homogenate and 0.721 mg for invertase after affinity chromatography. However, the specific activity, which is an indication of protein purity, was 0.51 for the homogenate and 24.96 for invertase. The percentage yield, which denotes the activity that is upheld after a purification step, was 112.5% for invertase. These outcomes represented a 48.94 level of purification, implying that the extent of affinity purification chromatography was approximately 50% efficient.
References
Bhalla, T. C., Thakur, N., & Thakur, N. (2017). Invertase of Saccharomyces cerevisiae SAA-612: Production, characterization and application in synthesis of fructo-oligosaccharides. LWT, 77, 178-185.
Tymoczko, J. L., Berg, J. M., Gatto Jr., G. J., & Stryer, L. (2019). Biochemistry: A short course (4th ed.). WH Freeman.
Supplementary Materials
Standard Curves
Part B: Citrate Buffer pH 5
Part B: Tris Buffer pH 9
Part C
Completed Datasheets
Table 1: Determining enzyme activity at pH 5 and pH 8.
Table 2: Detecting beer in sucrose by DNS Assay.
Table 3: Quantification of purification of invertase.
Sample Calculations
Part A (Calculation of Invertase Dilution)
The formula C1V1= C2V2 where C1 is the concentration of purified enzyme, V1 is the volume of the purified enzyme, C2 is the concentration of diluted enzyme, and V2 is the volume of the diluted enzyme.
C1= 553.8 ug/mL; V1= unknown; C2= 500 ug/mL; V2= 1.2 mL
V1= C2V2/C1
V1= (500 ug/mL ×1.2 mL)/553 ug/mL
V1= 1.085 mL, which is equal to 1085 uL
Part B
The standard curve equation at pH 5 is Y=1.7277X+ 0.0607, whereas the absorbance value is 0.788. The concentration of reducing sugar is calculated by substituting the value of Y in the equation and solving for X as follows:
0.788= 1.7277X+ 0.0607
0.788-0.0607= 1.7277X
0.7273= 1.7277X
0.7273/1.7277= X
0.42= X
X= 0.42 mM.
The standard curve equation at pH 9 is Y=1.9573X+ 0.039, whereas the absorbance value is 0.059. The concentration of reducing sugar is calculated by substituting the value of Y in the equation and solving for X as follows:
0.059= 1.9573X+ 0.039
0.059-0.039= 1.9573X
0.02= 1.9573X
0.02/1.9573= X
0.010= X
X= 0.01 mM.
Part C
The standard curve equation for sucrose content in beer at pH 5 is Y=1.6057X+ 0.1024, whereas the absorbance value for no. 5 is 0.752. The concentration of reducing sugar is calculated by substituting the value of Y in the equation and solving for X as follows:
0.752= 1.6057X+ 0.1024
0.059-0.1024= 1.6057X
0.6496= 1.6057X
0.6496/1.6057= X
0.40= X
X= 0.40 mM.
For no. 8 (beer 1), the absorbance value is 0.246, which yields a concentration of 0.09 mM of reducing sugar. However, the beer was diluted by a factor of 25 before analysis. Therefore, the final concentration is 0.09 mM× 25 (dilution factor), which gives 2.25 mM.