Introduction
Stone container operates in the United States of America and was heavily indebted in 1983 because of acquisitions, which were highly indebted. The company required a financial plan, which was going to change its capital structure to the better. Various options were considered from debt capital to equity.
In financing the operations of a company the management should be very careful in choosing the capital structure which favors long term sustainability of the operations. Increasing the debt capital in the capital structure for a company that is highly leveraged will be suicidal.
Financial statements- Common size analysis
Balance sheet
The trend balance items are not uniform as some items are increasing while others are decreasing. But the overall performance of balance sheet items indicates downward trend. From the common size financial statements, one will note that the gross profit margin appears to be decreasing. However, the net income shows a mixed result as it at times increases and later reduces. However, this ratio shows a better performance but the amount of profits involved is minimal because of the amount of sales.
Looking at the financing of current asset, you will find that most of the current assets are financed by long- term capital. The percentages of current assets to total assets remain stable of 36.36% with a standard deviation of 7%. In this case, they changed short-term investment to long-term investment. Looking at the percentage of liabilities to total assets, one will note that percentage of liabilities was declining as compared to the percentage for long-term liabilities.
Income statement
This shows that the company was having a down ward trend although profitability
Ratios
The Ratios calculated below shows the profitability is worsening as shown below;
Days on cash on hand ratio indicates the financial strength of a company to meet its current operations. This is an important measure as a company cannot have long-term growth prospects if it is unable to pay its day-to-day expenditures. Accounts Receivables Days Ratios indicate the effectiveness of the company’s credit policies. It enables a health care organization to develop credit policies that best satisfy its patients, enabling separate patient accounts for financial assistance, reduce bad debts and receivables
Debt service coverage ratio is the measure of an institution’s solvency and stipulates the necessity to maintain sufficient cash flows to service its debts. Similarly, Liabilities to Equity Ratio also indicates the long term viability of an institution and shows the proportion of debt financed by equity. This is particularly important for financial institutions, which lend loans to hospitals for heavy equipment.
Looking at their accounts receivable turnover ratio it appears to be increasing meaning that the management was improving the management of the collection of debts. It shows the credit policy of the company was improving. The accounts receivable turnover also increased showing there was good credit.
Inventory turnover ratio also increased showing sales were increased or the cost of inventory was reduced. From the trend observed it is evident that it will not meet short –term obligation now and in the near future although it is increasing. The technical adjustment that may be required is to adjust stock to net realizable value
Ebit-Eps Analysis
One widely used means of examining the effect of leverage is to analyze the relationship between earnings before interest and taxes (EBIT) and earnings per share (EPS). Essentially, the method involves the comparison of alternative methods of financing under various assumptions as to EBIT.
The company had long-term capitalization of $33067 million consisting entirely of common stock, wishes to raise another $5 million for expansion through one of three possible financing plans. The company may finance (1) all common stock, (2) all debt at 12 % interest, or (3) all preferred stock with an 11 percent dividend. Present annual earnings before interest and taxes are $ 2 million, the income tax rate is 40 percent, and 200,000 shares of stock are now outstanding.
To determine the EBIT break-even or indifference points between various financing alternatives, we begin by calculating earnings per share for some hypothetical level of EBIT. Suppose we wished to know what earnings per share would be under the three financing plans if EBIT were $ 2.4 million. The interest on debt is deducted before taxes, while available to common stockholders dividends are deducted after taxes.
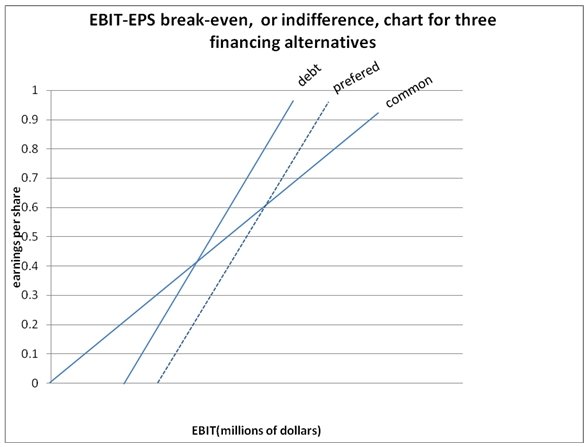
As a result, earnings available to common stockholders are higher under the debt alternative than on debt is higher than the preferred stock dividend rate. To construct a break-even, or indifference, chart. On the horizontal axis we plot earnings before interest and taxes, and on the vertical axis, earnings per share.
For each financing alternative, we must draw a straight line to reflect EPS for all possible levels of EBIT. To do so, we need two datum points for each alternative. The first is the EPS calculated for some hypothetical level of EBIT. For $2.4 million in EBIT we see in table 10-1 that earnings per share are $4.80, and 5.40 and $ 4. 45 for the common, debt and preferred stock financing alternatives.
We simply plot these earnings per share at the $2, 4 million marks in EBIT. Technically it does not matter which hypothetical level of EBIT we choose for calculating EPS. On good graph paper, one level is as good as the next.
The second datum point is simply the EBIT necessary to cover all fixed financial costs for a particular financing plan, and it is plotted on the horizontal axis. For the debt alternative, we must have EBIT of $600,000 to cover interest charges; so the money becomes the horizontal axis intercept. For the preferred stock alternatives , we must divide total annual dividends by one minus the tax rate in order to obtain the EBIT necessary to cover these dividends.
Thus we need $916,667 in EBIT to cover $550,000 in preferred stock dividends, assuming 40 % tax rate. Again preferred dividends are deducted after taxes. So it takes more in before-tax earnings to cover them than it does to cover interest. Given the horizontal axis intercepts and earnings per share for some hypothetical level of EBIT, we draw a straight line through the two sets of points. The break-even or indifference, chart for Cherokee tire company.
We see from the figure that the earnings per share indifference point between the debt and common stock financing alternatives is $1.8 million in EBIT. The preferred stock alternative is favored within respect to earnings per share. Below it the common stock alternative is best. Note that there is no indifference point between the debt and preferred stock alternatives. The debt alternatives dominate all levels of EBIT and by a constant amount of earnings per share $.95

Pro-former financial statements
All figures in millions
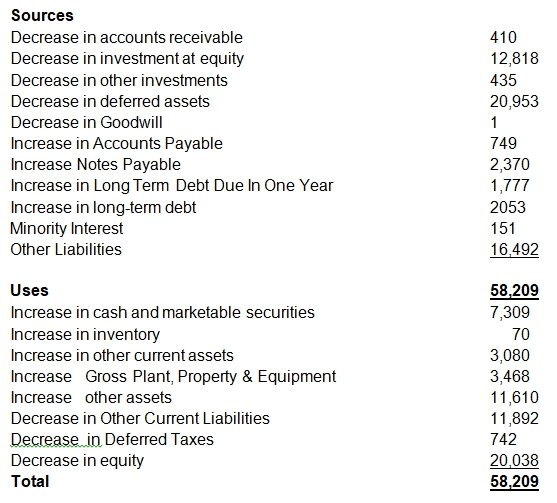
Statement sources and uses

Cash flow statements are used for a very unique and revealing purpose in business. Before the purpose is discussed, it is prudent to discuss why the need for it arises; there are some instances in the business operations that a business, on the outset, may be seen as generating profits. However, even though it must be generating profits, it may be experiencing a shortfall in the cash.
Therefore, the purpose of cash flow statement is to help internal and external stakeholders to decide how such situations occur. For example, cash flow statement analysis can be a good evaluative tool to judge the potency of a business to pay the monthly bills by explaining the sources and uses of cash and explaining the changes in cash balance.
Since it is divided and organized into operational, investing and financing activities, the cash flow statements can help the internal managers as well as the investors with the data it provides.
Financing decision
Stone Container had an operating loss as shown in the case study and had outstanding long-term debt and combined with its decrease in revenues and margins, there is doubt that the company will be able to pay its interest and maturing principal debts in the near future. Because of this, the company is at high risk because its cash flows will have to be allocated for those principal and interest payments. Stone Container has several options to manage this debt including divestment of certain prime properties of which they have plenty.
Capital is the combination of debt and equity used to finance a company. Generally, bonds are similar to loans in the sense that they promise payoffs, while equity is similar to ownership, in the sense that the owners share whatever is left after obligations to bondholders have been met. Therefore, the company needs to have a low or medium debt equity ratio. Moreover, future financing should be short to medium term because it is currently sensitive to factors like market conditions and inability to meet its debt covenant requirements.