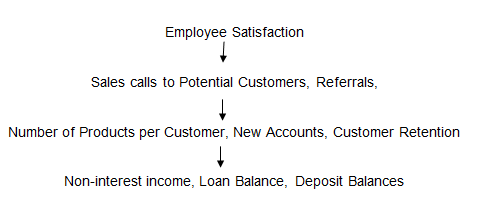
Table 1: Balanced Score Card for the Southern Division.
Cause and effect Chain 1

Causal Chain Explanation
When the employees of Tri-Cities Community Bank (TCCB) are satisfied due to knowledge gained during training, their performance will improve and because of this, there will be increase the number of calls made to potential and exciting customers, which will in turn increase the number of products per customer.
Moreover, customers will open new accounts and the bank will be able to retain its customer base. The increased number of products per customer and new accounts opened will lead increase in the non-interest income, increase in deposits by customers and improved loan balances.
Cause and effect Chain 2

Causal Chain Explanation
According to (Wentland, 2007, p.77) when employees are well trained for the job, their skills match the job requirement which increases the employee’s ability to perform the job efficiently and effectively and in turn reduce employee turnover rate.
Reduced turn over rate will enable the bank to increase the number of referrals made to customers, thank you calls to existing and new employees, and number of cross sales made.
This phenomenon will in turn lead to increased number of loans created, new customers and number of accounts opened. Eventually the bank will increase its non-interest income, increase in deposits by customers, and improve loan balances.
Table 2: Changes in financial performance of TCCB from the year 2000-2001 (Albright, Davis, & Hibbets, 2001, p. 54)
The southern division implemented the balance scorecard strategy in the year 2000 in their operations that is branches (A-E). The Northern divisions were a bit reluctant to implement the strategy; that is, branches (F-G). There is a huge disparity in the financial performance between the two divisions
The loan and balances in the branches in the Southern division have increased considerably compared to the Northern division whose increases were either negligible or non-existent.
For instance, branch (C), which is the branch with the highest increase in loans and deposits, has a difference of 7.6 million dollars compared to branch D in the Northern division whose loans and deposits stagnated.
Branch (F) from the Northern division recorded decrease of one million dollars in the deposit balance compared to branch C in the Sothern division, which recorded the highest increase of 12.3 million dollars.
Although one of the branches, (E), in the Southern division recorded a decrease on one million dollars in non-interest income, the rest of the branches in the division performed very well. The highest recorded an increase of 65 million dollars compared to their Northern counterparts who only managed to bring the highest increase from branch (G) as 21 million dollars.
Implementation of Balance Score card Strategy
According to (Kaplan, & Norton, 1996, p.281), for the balance scorecard strategy to be implemented successfully, management must incorporate employees’ ideas in the strategy by linking personal objects and rewards to attain the identified measures.
Branch A implemented the score with an aim of achieving its goals, which included increasing deposits, improving loan balances, and the non-interest income. They not only set challenging measures, but also gave employees incentives to achieve the measures.
As shown in table 2, Branch A was able to increase loan balances, deposits, and non-interest income by 3.4, 11.5, and 65 million dollars respectively. Branch B implemented the strategy to measure progress. It set challenging measures and made them attainable by offering employees incentives.
Branch B recorded increases of 9, 3.1, and 29 million dollars loan balances, deposits and non-interest income respectively. Branch C implemented the strategy to encourage teamwork between employees and after implementation, management constantly requested feedback on progress of the strategy.
AS a result, it recorded increases of 7.6, 12.3, and 55 million dollars loan balances, deposits, and non-interest income respectively as shown in table 2.
Branch D implemented the strategy to chart growth of the department by setting fair measures and offering incentives such as bonuses. Therefore, it recorded increases of 1.6, 6.4, and 15 million dollars loan balances, deposits and non-interest income respectively as shown in table 2.
Branch E had no plan; when implementing the strategy, measures were not communicated to the employees and the strategy was implemented to compare the branch’s performance with other branches. It recorded increases of 0.5, 1.1, and a decrease of 1 million dollars in loan balances, deposits, and non-interest income respectively as shown in table 2.
Conclusion
The balance scorecard strategy, after being implemented in the Southern division, led to improved performance compared to the Northern division branches as shown in table 2.
The strategy should be adapted in the Northern division and the implementation process should incorporate employees’ ideas and management should review progress of the strategy regularly after implementation as evidenced in branch C which recorded the highest increase in performance as shown in table 2.
References
Albright, T., Davis, S., & Hibbets, A. (2001). Tri-cities community bank: A balanced scorecard case. Strategic Finance, 8, 54-59.
Kaplan, R. S. & Norton, P. (1996). The balanced scorecard: translating strategy into action. USA: Harvard Business Press.
Wentland, D. M. (2007). Strategic Training of Employees. Armherst: HRD Press Inc.