Abstract
Food fraud is a common problem in the food value chain. Isotopic composition analysis is a renown analytical method that detects food fraud by measuring the relative isotopic composition of carbon, hydrogen and nitrogen in samples. The purpose of this study was to use isotope ratio mass spectroscopy (IRMS) to determine isotopic disparities of 15nitrogen, 13carbon and 2hydrogen in six cheese samples and distinguish them based on geographic, geological and agricultural practices. An IRMS coupled with an elemental analyser was used for the tests after which isotopic differences were tabulated. Italian cheese had the lowest δ15N (‰) of 4.74 followed by Gruyère cheese from Switzerland (δ15N (‰) of 5.78).
Cheese from Ireland and England had the highest d15N (‰) values of about 7.2. Goat milk cheese differed from cow milk cheese despite having the same geographical origin. The δ13C ranged from -22 to -28 for all the samples, whereas δ2H ranged from -76 to -120. Post-analysis chemometrics was not conducted. Therefore, it was not possible to cluster the various cheese samples into different geographical regions, geological conditions and agricultural practices. However, the results corroborated the literature values of stable isotope ratio data for cheese produced in various regions.
Introduction
Food fraud entails intentionally changing, corrupting, wrongful labelling, replacing or messing around with food products at any point within the food production and supply chain. These activities can be done for financial gain by raising the apparent value of the commodity or wrongfully reducing the cost of production, which can pose danger to consumers (Frew & Cannavan 2015). Misrepresentation can happen when an item is passed off as originating from a given country (Abbas et al. 2018). Fraud hampers market growth by destroying consumers’ confidence in food commodities.
Food safety is crucial to the food manufacturing business, food vendors, distributors and regulatory bodies because of its possible direct effect on public health. Apart from ensuring food safety by precluding microbiological, chemical and tangible risks, measures are in place to fight the dangers of food fraud (Fritsche 2018). Several analytical techniques are currently used to counteract food fraud.
They include chromatographic approaches such as liquid and gas chromatography (Hong et al. 2017) and spectroscopic techniques such as vibrational, near-infrared, Fourier-transform infrared and nuclear magnetic resonance (van Ruth, Huisman & Luning 2017). DNA based methods include polymerase chain reaction, DNA hybridization, Randomly Amplified Polymorphic DNA (RAPD), Sequence Characterized Amplified Region (SCAR) techniques among others (Manning 2016; Stadler et al. 2016).
The commonly used isotope and elemental procedure is isotope ratio mass spectrometry (IRMS), which is an analytical technique that quantifies the isotopic ratios precisely and accurately (Manca et al. 2006; Luo et al. 2015; Camin et al. 2016; Camin et al. 2017). This information can determine the authenticity of food items to counteract fraud and ascertain the geographical origin of food. IRMS has been applied extensively to battle food fraud in cheese and dairy products (Capici et al. 2015; Zain et al. 2016).
Isotopic analysis in food science is based on the fact that all living organisms are a product of what they consume and that prevailing physical, chemical and biological associations create a distinct isotopic signature known as Terroir (Parga-Dans & González 2018). The objective of the experiment was to use IRMS to discriminate various cheese samples based on isotopic differences. The carbon dioxide and nitrogen levels were used to measure the 13carbon to 15nitrogen ratios in the different cheese samples.
Methodology
Six pre-treated cheese samples from different geographical regions were tested. They included Parmigiano Reggiano from Italy, Dunmanus, Co. Cork from Ireland, Kidderton Ash Goats Cheese from England, Somerset Brie from England, Gruyère from Switzerland and Ballyblue from Northern Ireland. Defatted casein was then prepared using the protocol described by Camin et al. (2012). For IRMS analysis, frozen cheese samples were finely grated and freeze-dried overnight.
About 4g of the dried sample was placed in a 50 ml centrifuge tube and underwent three extractions with a 2:1 mixture (30 ml) of petrol ether: diethyl ether. Pellets were washed twice using 30 ml of MilliQ water. The first two extractions were conducted in a centrifuge at 13.500 rpm, whereas the third extraction was done using a vortex mixer at 2.500 rpm for 3 minutes. The casein pellet obtained after each extraction step was recovered by centrifugation at 4.100 rpm for 5 minutes. The final residue was lyophilized, hand ground and stored at room temperature before analysis.
About 0.5g of each sample was weighed and put in a capsule for combustion to determine the isotopic number. The weighed samples were then put in a flash elemental analyser to determine the percentage of carbon, hydrogen and nitrogen. The equipment used included Flash Elemental Analyser, TC-EA for the analysis of water and GC-C IRMS- CSIA. Two different temperatures of 1020°C and 650°C were used in the chromatographic columns.
However, other procedures were done at 41°C. Standards were used to calibrate the machines before analysis. They included a sample that was expected to produce more positive values than the test samples and another that was more negative than the test substances. Helium gas was used as the negative control because it had its own unique isotopic signature. Precautions were taken to wash and clean any substance, including machines because everything in nature contained carbon or nitrogen. Isotope values were calculated using the equation:

Data
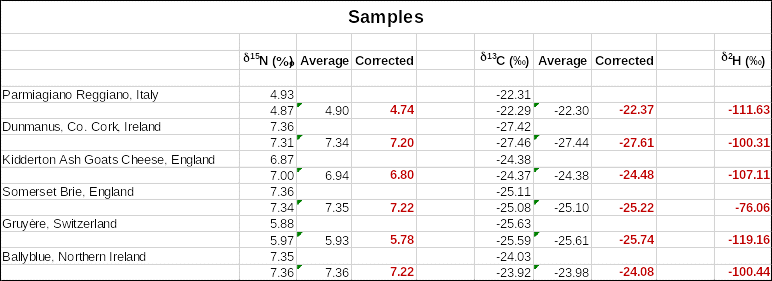
A two-point carbon calibration curve and a three-point nitrogen calibration curve were used to determine the δ13C (‰) and δ15N (‰) as shown in Figures 1 and 2 below. The specific values of corrected δ15N, δ13C and δ2H are indicated in Table 1. The plots in Figures 1 and 2, as well as the values in Table 1, were obtained using Microsoft Office Excel software. No chemometrics was used for further analysis of the data.
Only the means were used to determine corrected values from the calibration curves by adjusting for any instrument errors. Italian Parmigiano Reggiano cheese had the lowest δ15N of 4.74 followed by Gruyère cheese from Switzerland with δ15N of 5.78. On the other hand, cheese from Ireland had the highest δ15N values of 7.2 and 7.22. One notable observation was that two kinds of cheese from England had different δ15N values of 6.8 and 7.22 for Kidderton Ash Goats Cheese and Somerset Brie respectively. The δ13C and δ2H values did not follow the same trend as the δ15N values in the different cheese types.


Discussion
Studies show that δ15N (‰) change based on soil depth, climate and vegetation (Camin et al. 2004; Bontempo et al. 2012). The extensive use of organic fertilizers, as well as water stress and proximity to the sea, usually increases the δ15N‰ values (Stevenson, Desrochers & Hélie 2015). These values often range between -10‰ and +15‰. The experimental findings were all positive and fell within this limit thereby indicating that the cheese originated from areas with rich soils and that organic farming was used during production.
Furthermore, Camin et al. (2016) suggest that organic milk should have δ13C (-26.5 ‰) and δ15N (+5.5 ‰), which was satisfied by cheese from Switzerland and Italy. The documented nitrogen values for Italy and Northern Ireland cheese is 4.5 and 7.3 while the observed values were 4.74 and 7.22, respectively. There was no significant difference between the experimental and accepted nitrogen values.
The hydrogen and oxygen isotopic signature from a food sample is a direct indicator of the source water used in its production, which points towards the geographical source of the product and guides authentication and traceability (Stevenson, Desrochers & Hélie 2015; Valenti et al. 2017). In plants, the isotopic constituent of vegetal water is a factor of water absorbed from the soil. Climatic conditions and precipitation also influence water levels and composition.
Moreover, evapotranspiration, which is influenced by relative humidity and temperature, affects the vegetal water in the leaf thus leading to isotopic fractionation. Heavier isotopes are then enriched, which augments the δ2H and δ18O values of plants grown in such areas as well as the products of animals that feed on these plants. The δ18O values were not measured in this study. However, the δ2H values were enriched significantly in Somerset Brie cheese from England. The δ13C of animal products is largely influenced by components of the animal’s diet, types of photosynthetic cycles experienced by plant feeds and soil types.
Conclusion
The purpose of this experiment was to distinguish between different cheese samples based on the isotopic ratios of 13carbon, 15nitrogen and 2hydrogen using IRMS. Italian cheese had the lowest δ15N value of 4.74, whereas cheese from Ireland had the highest δ15N values of 7.2 and 7.22. Chemometrics could be done to facilitate the application of δ15N, δ13C and δ2H values to separate the cheese samples based on variables such a geography, climate (precipitation), soil type, geology and agricultural practice.
Reference List
Abbas, O, Zadravec, M, Baeten, V, Mikuš, T, Lešić, T, Vulić, A, Prpić, J, Jemeršić, L & Pleadin, J 2018, ‘Analytical methods used for the authentication of food of animal origin’, Food Chemistry, vol. 246, pp. 6-17.
Bontempo, L, Lombardi, G, Paoletti, R, Ziller, L & Camin, F 2012, ‘H, C, N and O stable isotope characteristics of alpine forage, milk and cheese’, International Dairy Journal, vol. 23, no. 2, pp. 99-104.
Camin, F, Boner, M, Bontempo, L, Fauhl-Hassek, C, Kelly, S, Riedl, J & Rossmann, A 2017, ‘Stable isotope techniques for verifying the declared geographical origin of food in legal cases’, Trends in Food Science & Technology, vol. 61, pp. 176-187.
Camin, F, Bontempo, L, Perini, M & Piasentier, E 2016, ‘Stable isotope ratio analysis for assessing the authenticity of food of animal origin’, Comprehensive Reviews in Food Science and Food Safety, vol. 15, no. 5, pp. 868-877.
Camin, F, Wehrens, R, Bertoldi, D, Bontempo, L, Ziller, L, Perini, M, Nicolini, G, Nocetti, M & Larcher, R 2012, ‘H, C, N and S stable isotopes and mineral profiles to objectively guarantee the authenticity of grated hard cheeses’, Analytica Chimica Acta, vol. 711, pp. 54-59.
Camin, F, Wietzerbin, K, Cortes, A, Haberhauer, G, Lees, M & Versini, G 2004, ‘Application of multielement stable isotope ratio analysis to the characterization of French, Italian, and Spanish Cheeses’, Journal of Agricultural and Food Chemistry, vol. 52, no. 21, pp. 6592-6601.
Capici, C, Mimmo, T, Kerschbaumer, L, Cesco, S & Scampicchio, M 2015, ‘Determination of cheese authenticity by carbon and nitrogen isotope analysis: Stelvio cheese as a case study’, Food Analytical Methods, vol. 8, no. 8, pp. 2157-2162.
Frew, R & Cannavan, A 2015 ‘Using nuclear techniques to combat food fraud’, Food & Environmental Protection Newsletter, vol. 18, no. 1, pp. 7-10.
Fritsche, J 2018, ‘Recent developments and digital perspectives in food safety and authenticity’, Journal of Agricultural and Food Chemistry, vol. 66, no. 29, pp. 7562-7567.
Hong, E, Lee, SY, Jeong, JY, Park, JM, Kim, BH, Kwon, K & Chun, HS 2017, ‘Modern analytical methods for the detection of food fraud and adulteration by food category’, Journal of the Science of Food and Agriculture, vol. 97, no. 12, pp. 3877-3896.
Luo, D, Dong, H, Luo, H, Xian, Y, Guo, X & Wu, Y 2015, ‘Multi-element (C, N, H, O) stable isotope ratio analysis for determining the geographical origin of pure milk from different regions’, Food Analytical Methods, vol. 9, no. 2, pp. 437-442.
Manca, G, Franco, MA, Versini, G, Camin, F, Tola, A 2006, ‘Correlation between multielement stable isotope ratio and geographical origin in Peretta cows’ milk cheese’, Journal of Dairy Science, vol. 89, no. 3, pp. 831-839.
Manning, L 2016, ‘Food fraud: policy and food chain’, Current Opinion in Food Science, vol. 10, pp. 16-21.
Parga-Dans, E & González, PA 2018, ‘From paper to soil: the impact of new EU alcoholic drinks labeling regulations for wine regions’, Journal of Consumer Protection and Food Safety, vol. 13, no. 1, pp.89-94.
Stadler, RH, Tran, LA, Cavin, C, Zbinden, P & Konings, EJ 2016, ‘Analytical approaches to verify food integrity: needs and challenges’, Journal of AOAC International, vol. 99, no. 5, pp. 1135-1144.
Stevenson, R, Desrochers, S & Hélie, J 2015, ‘Stable and radiogenic isotopes as indicators of agri-food provenance: insights from artisanal cheeses from Quebec, Canada’, International Dairy Journal, vol. 49, pp. 37-45.
Valenti, B, Biondi, L, Campidonico, L, Bontempo, L, Luciano, G, Di Paola, F, Copani, V, Ziller, L & Camin, F 2017, ‘Changes in stable isotope ratios in PDO cheese related to the area of production and green forage availability. The case study of Pecorino Siciliano’, Rapid Communications in Mass Spectrometry, vol. 31, no. 9, pp. 737-744.
van Ruth, SM, Huisman, W & Luning, PA 2017, ‘Food fraud vulnerability and its key factors’, Trends in Food Science & Technology, vol. 67, pp. 70-75.
Zain, SM, Behkami, S, Bakirdere, S & Koki, IB 2016, ‘Milk authentication and discrimination via metal content clustering–a case of comparing milk from Malaysia and selected countries of the world’, Food Control, vol. 66, pp. 306-314.