Introduction
Scientists normally derive relationships connecting parameters on the basis of “modeling” which is basically “guessing” a function and trying to fit in parameters. Hence, the essence of this experiment is to understand how scientist achieve and accomplish the same. These relationships are vital in the derivation of scientific principles.
In this experiment, the aim was to derive a relationship between the mass and the diameter of clay spheres to obtain the density. Seven clay spheres of different dimensions were taken alongside their masses which were recorded for analysis. A model equation, m=a (d)n, was obtained courtesy of a prior knowledge of the relationship between the mass, density and volume. The value of n (density) that would linearise the equation on the GA was obtained. Another linearised graph, Ln d against Ln m, was plotted to confirm the value of n. From the experiment, the values of n for the two graphs were approximately equal to 3. The value of ‘a’ for the two graphs was approximately equal to 0.9. Hence, the relationship is connected by the formula; m=0.9d3.
There were slight discrepancies in the values of the slopes, ±0.0015 and ±0.105, for both root equation and Ln-Ln axes respectively. This has a bearing on the nature of the material of the sphere which succumbs to slight pressure and as such subject to faulty vernier reading. This can be minimized by the use of more firm materials. Otherwise the experiment achieved its objective of ‘modeling’ an equation of the relationship between m and d.
Objective of the experiment
The objective of this experiment is to understand the idea behind scientific “modeling” of physical effects which forms the basis for scientific principles.
Procedure
In this experiment, clay spheres were made with nominal diameters between 1 and 7cm. Several independent readings of the diameters were taken and the average diameter recorded. The corresponding masses of the spheres were then taken and recorded for analysis in GA.
Results
The results obtained from the analysis of the data were: the constants connecting the relationship between the mass, m, and the diameter, d, for both plots were approximately equal. That is: n≈3 and a≈0.9. Therefore, the modeled relationship of the parameters is given by: m=0.9d3. The log-log axes obtained a straight line graph connected by the formula shown below:
Ln d=0.330 Ln m±0.0015+0.050±0.042
Data analysis
To formulate a relationship between the diameter and the mass, knowledge of the relationship between mass, volume and density is vital. Since mass (m) =density *volume, and volume is directly proportional to the diameter (d); a relationship between the mass and the diameter can be obtained as below.
m=a (d) n
Where ‘n’ is a power connecting a linear relationship, and ‘a’ is the gradient of a straight line that represents the density.
A linearized plot can be obtained from this relationship by either introducing the logs or the natural logs (Feynmans 23). For instance, if we introduce the natural logs the below relationship is obtained.
Ln m = Ln a +n Ln d
Rearranging:
Ln d =1/n (Ln m) – (Ln a)/n
Thus, it can be deduced that if Ln d is plotted against Ln m then the reciprocal of the gradient will give the value of n (the density) while (Ln a)/n is the y intercept. Alternatively, the density can be obtained directly from the relationship below:
m =a (d) n
This is possible by the virtue of finding an appropriate value of n that would linearise the relationship between d and m. As a result, the plot of (d) n against m will give 1/a as the gradient as shown below:
dn=(1/a)m
By the aid of the GA, the value of n was obtained to as 3. Thus, d3= (1/a) m.
From the experiment, the data below was obtained.
Uncertainty in d3 = (maximum (d3)-minimum value (d3))/2
= (1.073-1.053)/2
= 0.033709≈0.034
Uncertainty in Ln m= (maximum Ln m- minimum Ldn m)/2
= (Ln 1.1-Ln 0.9)/2
=0.1003353≈0.100
Uncertainty in Ln d= (maximum Ln d-minimum Lnd)/2
= (Ln1.07-Ln1.05)/2
=0.0094432≈0.009
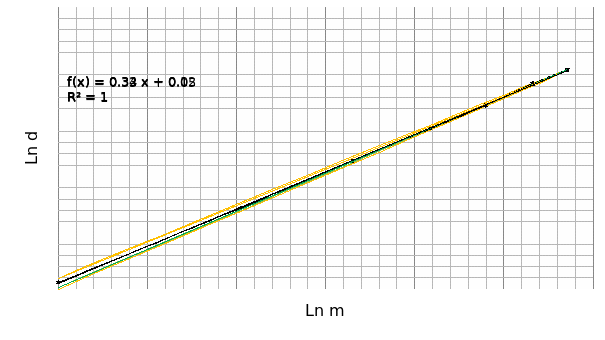
The graph of Ln d against Ln m appears as in the graph 1 below:

From the plots of minima and maxima the uncertainty in the slope can be obtained from the expression: max slope-min slope.
Thus, 0.337-0.322= 0.0015, this is given as ±0.0015
Uncertainty in the y intercept= (0.099-0.015)/2=0.042
Therefore, the equation appears as Ln d=0.330 Ln m±0.0015+0.050±0.042

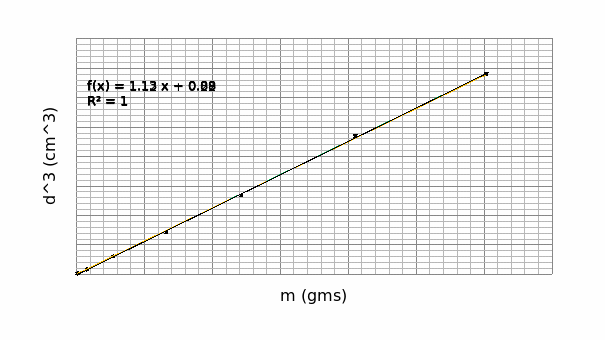
From the maxima and minima plots, the uncertainty in the slope and the y intercept are given as:
Uncertainty in the slope= (1.133-1.121)/2=±0.105
Uncertainty in the y intercept= (0.215-0.089)/2=±0.063
Thus, the equation appears like; y= 1.132x±0.105+0.879±0.063
From graph 1, 1/n=slope=0.33
Therefore, n=1/0.33=3.033≈3.0
The y intercept (-(Ln a)/n) = 0.050
Therefore, Ln a=3*(- 0.05) =-0.15
a= 0.8607≈0.9
From graph 2, n=3
The slope, 1/a, =1.132
Therefore, a=0.8834≈0.9
From the calculations above, the two graphs have confirmed the values obtained from either graph. The value of the density (n) from the two graphs is approximately equal to 3. Correspondingly, the values of, the constant a, are approximately equal to 0.9. It can be deduced that the relationship between the mass and the diameter of the spheres take the function:
m=0.9d3
Where m is the mass and d is the diameter. The density, 3, is constant.
Discussion
The essence of this experiment was to comprehend the idea behind scientific ‘modeling’ of physical quantities that form the basis of scientific principles. In this experiment, two data sets were plotted to confirm the physical quantities of either graph. A model formula, m=a (d) ^n, was formulated courtesy of the knowledge of the idea of the relationship between the mass, density and the volume. The graph plotted was linealized when the power (n), the density of the clay, was equivalent to 3. This gave a graph with a gradient, a, approximately equal to 0.9. Plots of the natural logarithms of d against m confirmed these values with the value n (3.033) being approximately equal to 3. The value of ‘a’ obtained gave an approximate value of 0.9. Consequently, on replacing the constants, the formula connecting these parameters is given as: m=0.9(d) ^3.
The plot d^n against m ought to pass through the origin however, due to uncertainties, the graph cuts the y axis at -0.789. These uncertainties could be as a result of experimental design. One major factor that might have brought these deviations could be the nature of the material (clay) that may deform under slight pressure. This may give a faulty measurement of the diameters. Also, one might not obtain a uniform sphere through modeling. In future experiments I would advise for the use of firmer materials that might not succumb to pressure. Otherwise, the experiment achieved its objective.
Conclusion
According to the results obtained, the experiment achieved its objective. The objective of this experiment was to model physical parameters to obtain a formula connecting these physical quantities. From the analysis done on the relationship between the mass, density and the diameter, the function obtained was m=0.9d3. The power, 3, is the density of clay.
Work Cited
Feynmans, Richard. Lectures in Physics. Boston, Massachusetts: Addison Publishing Company, Addison, 1969. Print.