US in recession
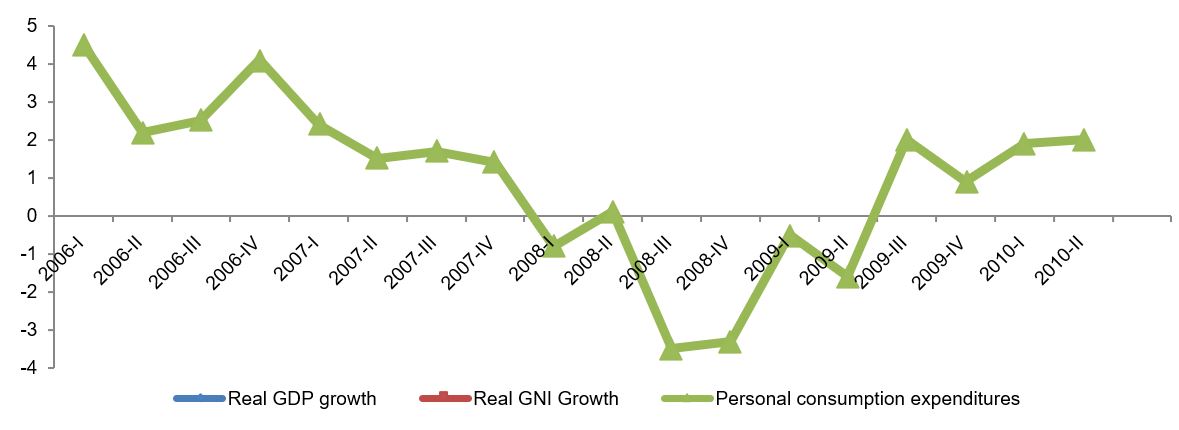
NBER declared in December 2008 that the US economy had gone into a recession in December 2007 (NBER, 2008). Recession, according to NBER, is defined as a significant deceleration in economic activity of an economy, and that spreading across various sectors of the economy. The NBER committee for deciding the business cycle looks into data related to sector wise production, employment, real income, etc. (NBER, 2008). The macroeconomic indicator that is observed by NBER derived from BEA is quarterly data of real gross domestic product (GDP) and real gross domestic income (GNI). Figure 1 demonstrates the changes in real GDP and GNI since first quarter of 2006 through second quarter of 2010.

The US economy has been experiencing a fall in the real GDP since first quarter of 2006; however, it was a persistent downfall. However, it was from the last quarter of 2007, that the economy registered a persistent fall in the real GDP growth rate. The situation became worse from the second quarter of 2008, when the economy went into a phase of negative economic growth that continued until third quarter of 2009. On looking at other data related to the recession, it can be observed that personal consumption of the US economy fell in line with the fall in the growth of real GDP. The fall in consumption was highest in case of durable goods like automobiles, household furnishings, recreational goods, etc. the total industrial production fell considerably during the period. In 2008, industrial growth was at -7.6 percent and then fell by -3.8 percent in 2009 (FED, 2010). Therefore, the observation of these figures presented by BEA demonstrates and supported NBER claim of 2008 that the US economy went into a recessionary phase in last quarter of 2007.
Measures for recovering GDP
The first step taken by the US government aiming at recovering the GDP during the 2008-10 recessions was an incentive given to first time home buyers and “cash for clunkers” in order to provide impetus to the manufacturing and real estate sector (Homan, 2009). Further, the government took many steps to help the private sector to recover. First were a series of bail out given from the government exchequer for private companies like Ford and GM. Fiscal stimulus presented by the US government in terms of tax cuts had helped government to reduce unemployment and therefore increase real GDP. Further, government expenditure was increased considerably in order to help state governments retain employees, maintain investment on infrastructural projects, and reduce taxes. The reduction in taxes was known as the “financial crisis responsibility fee” (The Economist Intelligence Unit, 2010, p. 13). However, the fall in tax revenue led to deepening of the US fiscal deficit. Further, there were stimulus measures taken by the government to increase employment as there were 85000 job cuts in December 2009 (The Economist Intelligence Unit, 2010). The federal government brought in a stimulus package of $154 billion to be spent on infrastructure projects that were expected to improve the unemployment situation (The Economist Intelligence Unit, 2010). The monetary policies taken by the Federal Reserve gave monetary stimulus to the economy in order to increase private consumption and give impetus to the financial sector of the country, by reducing the rate of interest to almost zero. Therefore, the US government took both fiscal and monetary policies to help the country recover from the recession of 2008-10.
Recent GDP Data in Detail
There was a fall in percentage change of GDP during 2008 and 2009 (BEA, 2010). Quarterly percentage change in real GDP demonstrates that the real GDP started falling from the second quarter of 2008 through second quarter of 2009. During this period, there was decline in personal consumption that declined. The decline was greater for durable goods that included automobile, household furnishing, etc. further there was a greater fall in non-durable consumption. Gross private consumption fell by 50 percent in first quarter of 2009 pertaining to fall in fixed invest, residential invest, and non-residential investment. There was a huge fall in export of goods, as the global demand during the period was equally skewed. There was a clear increase in the government consumption expenditure during the period, especially in the nondefense expenditure. The government incurred this expenditure in terms of fiscal stimulus to recover GDP growth. Personal consumption as a percentage of GDP fell from 70.6 percent in first quarter of 2007 to 69.9 percent in third quarter of 2008. This demonstrates that the personal consumption that composed of a major part of the US GDP fell by 1 percent. Real GDP fell by 1.9 percent in first quarter of 2008 from first quarter of 2007. The previous year’s quarterly growth started to fall in 2008 and it became negative from third quarter of 2008 through third quarter of 2009. This demonstrates that the US economic growth was stagnated completely due to the fall in private consumption and depreciation in production. Similarly private consumption growth from the quarter one year back showed similar declining trend indicating a fall in the private expenditure from previous year. Overall, the final sales to domestic product became negative in the same quarters of 2008 through 2009, when GDP growth was negative. Further, there was also a falling disposable personal income. However, this increased in second quarter of 2008, fell by 8.5 percent in next quarter, and then kept increasing until it fell in first quarter of 2010. This even though disposable income of the people increase, consumer confidence being low, drove down private consumption expenditure, thereby reducing GDP.
Per Capita Product and Income Series in Current and Chained Dollars
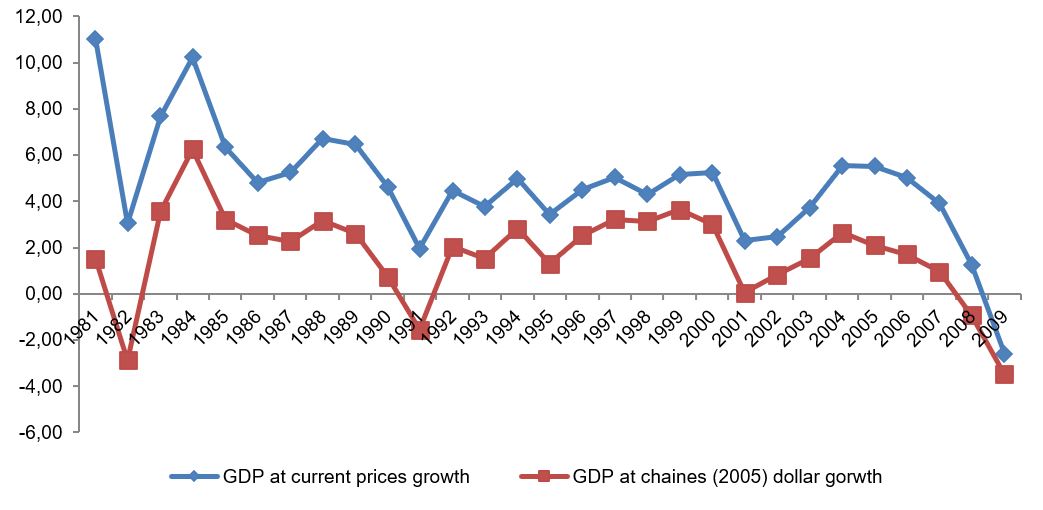
The study of the Per Capita Product and Income Series in Current and Chained from 1980 to 2009 demonstrates that the changes in macroeconomic indicators were greater for values given in current values than those chained at 2005 prices. This demonstrates the fluctuation in the absolute value of the macro indicators due to inflation.

The above figure shows that the GDP growth has been mobbing in a cyclical manner since 1980. From 1983, the economy recovered from a deep fall in GDP in 1982. Then there was a swing towards a rise in GDP at current prices, but there was a fall in the GDP in chained dollars. The US economy went into a recession in the 1990s when the GDP started falling, along with which there was a fall in disposable income, GNP, and private consumption expenditure (BEA, 2010). Then there was a period of low growth of economy from 1992 through 2001, after which the economy started its journey towards recovery. The journey continued till end of 2007, after which the economic growth again fell, and it was the worst fall in the last two decades.
References
BEA. (2010). Gross Domestic Product: Fourth Quarter 2009 (Advance Estimate). Web.
BEA. (2010). National Economic Accounts. Web.
FED. (2010). Industrial Production and Capacity Utilization. Web.
Homan, T. R. (2009). U.S. Economy: GDP Contracts 1% as Recovery Approaches. Web.
NBER. (2008). Determination of the December 2007 Peak in Economic Activity. Web.
The Economist Intelligence Unit. (2010). Economic policy. Country Report. United States. Web.