Introduction
Background
Concrete is a conventional building material because it is not only durable but also made easily during construction. Concrete deterioration is one of the major issues in the construction industry that causes defects in structures. The understanding of the causes and the rate of concrete deterioration forms the basis of constructing enduring structures. Normally, concrete deterioration is subject to numerous forces, which collectively contribute to overall deterioration. Poor construction practices, harsh weather conditions, and chemical reactions are some of the major causes of concrete defects in most structures. According to Gollu et al. (2016), aggregate expansion, bacterial corrosion, seawater effects, chemical damage, calcium leaching, and physical damage are some of the causes of concrete defects. In essence, physical, chemical, and biological factors interact in the environment and contribute to the deterioration of concretes.
The nature of defect varies depending on the causes and exposure condition resulting in the formation of the hairline crack, single crack, multiple cracks, minor spalling, severe spalling, spalling on exposed reinforcement, demolishing, minor repair, or major repair. The defects also varied according to the construction designs such as in-situ reinforced, composite in-situ, composite, pre-stressed, precast, plain, culvert, brick, box culvert, and barrel rail parapet types of concretes. Structures can be footbridges, over-bridge, under-bridge, gantry bride, or wall. When defects occur, they can fall under insignificant, serviceable, or very significant in the aspect of urgency repair. In this view, this research paper examines member type, exposure condition, and urgency of repair relative to three types of concrete defects, namely, minor defects, minor spalling, and major deterioration.
Problem Statement
Concrete deterioration is a major issue in the construction industry because it reduces the durability of structures, weakens the stability of buildings, causes the loss of lives, and contributes to the loss of property. Since there are numerous causes of concrete deterioration, which range from structural design to environmental factors, it is difficult to point out the exact cause of a specific deterioration (Gollu et al. 2016). Some concrete effects occur due to a single cause while others occur due to multiple causes. To understand the causes of concrete defects, construction engineers need to identify real causes and recommend appropriate repair interventions to prevent the occurrence of major structural disasters. Nepal and Chen (2015) explain that reinforcement corrosion is a major problem in the construction industry because it contributes to the occurrence of concrete defects and structural disasters. The adequate inspection of structures for concrete defects requires the understanding of diverse causes and the degree of their impacts on different forms of concrete deteriorations. In this view, a comparison of the degree of defects with exposure condition, the urgency of repair, and member type of defect would provide important information about the causes and the occurrence of concrete defects.
Aims and Objectives
- To determine the relationship between member type of defect and the defect number of concrete defects that occurred on the bridge.
- To determine the relationship between the exposure condition and the defect number of concrete that occurred on the bridge.
- To establish the relationship between the urgency of repair and the defect number of concrete occurred on the bridge.
Literature Review
Across the globe, there is an increasing concern for premature deterioration of concrete structures. Narwaria and Tiwari (2016) note that minor concrete defects hasten the deterioration of concretes for they allow leakage and passage of water, chemicals, oxygen, and other gases. Essentially, the lack of standardization in the design of concretes is one of the factors that contribute to premature deterioration of structures. In this view, Narwaria and Tiwari (2016) recommend the expansion of standard and effective alignment with exposure conditions provides an effective way of predicting deterioration and sustainability of structures. Therefore, effective classification of exposures and defects enables prediction of deterioration of concrete structures and optimize maintenance operations.
Visual inspection of concrete defects is necessary to detect minor defects and prevent their progression into minor spalling and major deterioration. Given that diverse causes contributes to the occurrence of concrete defects, construction engineers hold that the common preventable causes are inferior workmanship, corrosion of steel, poor design of structures, and inadequate specifications of concrete components. Corrosion of steel used in reinforcing steel is a serious cause of concrete defect because it results in structural collapse, loss of property, and even lives (Gollu et al. 2016). Moisture, temperature, chemical factors, physical factors, and biological factors contribute to corrosion of reinforcing steel and concrete defects. According to Estokov et al. (2012), Acidithiobacilli spp is bacteria that oxidize sulfur and corrode concretes resulting in their deterioration. Excess moisture and high temperature causes expansion of concrete and destabilizes cement resulting in concrete defects such as cracks, spalling, and major deterioration.
Chemicals such as salt and sulfuric acid hasten corrosion while physical factors such as abrasion, stress, and strain cause concrete defects. In their study, Zhang et al. (2014) established that alkali reactions and freeze-thaw cycles are major causes of spalling and cracks. As biological factors, plants, fungus, sponges, and bacteria cause concrete defects by releasing chemicals that speed up the corrosion of steel and deterioration of concrete. Thus, understanding of the extent and degree to which these factors contribute to concrete defects is critical in the protection of concrete, prevention of deterioration, and enhancement of durability.
Construction engineers have classified concrete defects according to member type, exposure condition, possible cause, defect, construction design, structure type, and the urgency of repair. The classification of concrete defects is important for it allows construction engineers to assess the degree and the nature of defects so that they can make appropriate repairs and strengthen structures (Gollu et al. 2016). Member type is a form of concrete defect that measures strengths of concrete in terms of flexural, compression, joint, parapet, and other forms of strength. As the degree of exposure determines the rate of deterioration, the exposure condition can be mild, moderate, severe, very severe, or extreme. The possible causes of concrete defects can be early age cracking, over-stressing, impact, corrosion, or a combination of unknown causes.
Regular inspection of buildings is essential for effective maintenance and prevention of disasters. As outdoor climatic conditions cause concrete deterioration, construction engineers assume that they deteriorate faster and require urgent repair than unexposed parts. In their assessment of deterioration of concrete in outdoor conditions, Lahdensivu et al. (2013) found out that lack of systematic assessment results in inexpensive maintenance of structures due to early and unnecessary repairs. In this view, construction engineers should assess structures and take precautions not to overlook damages or undertake unnecessary repairs while concrete is still strong.
Statistical Analysis
Histograms
Minor Defects
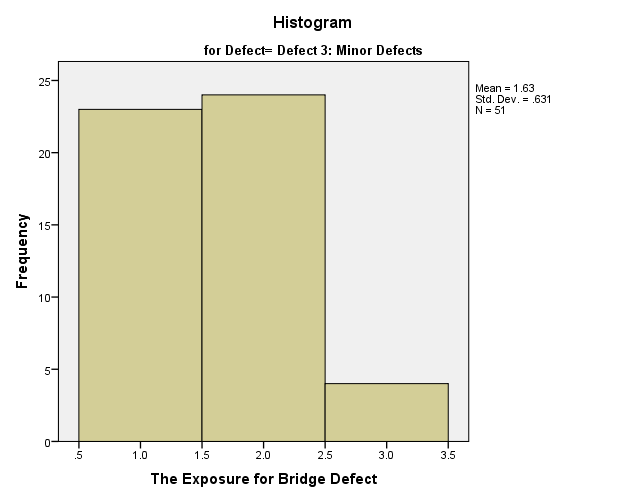
The histogram below (Figure 1) shows that the exposure conditions that cause minor defects (defect number 3) are mild, moderate, and severe exposures.
Minor Spalling
Major Deterioration
Descriptive Statistics
Descriptive Statistics for Minor Defects
Table 1
Descriptive Statistics for Minor Spalling
Table 2
Descriptive Statistics for Major Deterioration
Table 3
Probability Distribution Plot
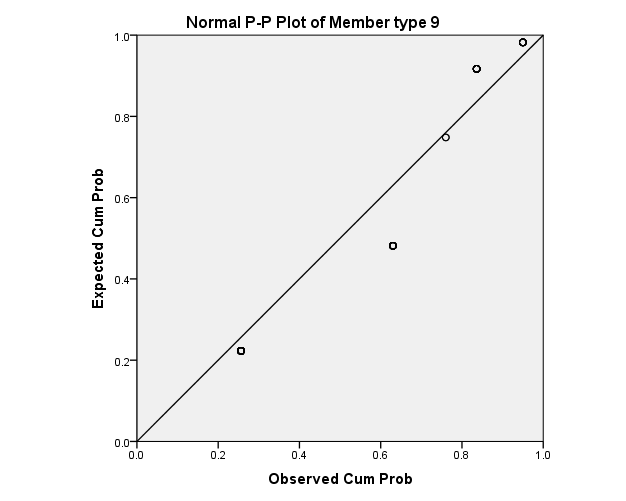
P-P Plot for Minor Defects
P-P Plot for Minor Spalling
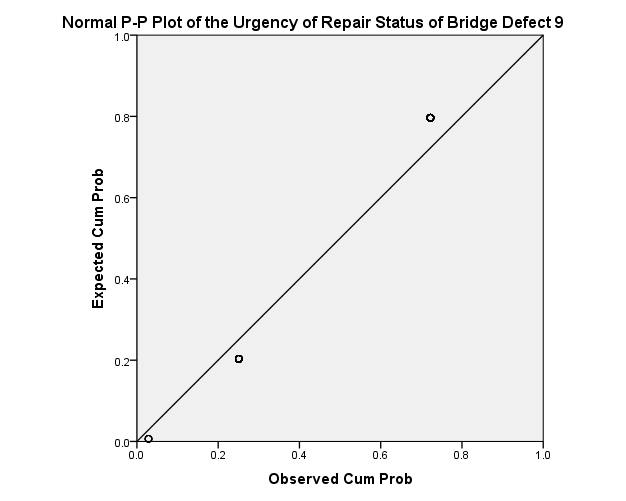
P-P Plot for Major Deterioration
Confidence Interval
Minor Defects
Table 4
Minor Spalling
Table 5
Major Deterioration
Table 6
Independence of Data
Z-Test
Table 7
T-Test
Table 8
Chi-Square Test
Table 9
Table 10
Table 11
Mean Plot and Linear Regression Analysis
Mean Plots
Linear Regression Analysis
Exposure Condition and Defect Number
Table 12
Table 13
Table 14
Urgency of Repair and Defect Number
Table 15
Table 16
Table 17
Member Type and Defect Number
Table 18
Table 19
Table 20
Discussion of Results
Minor Defects
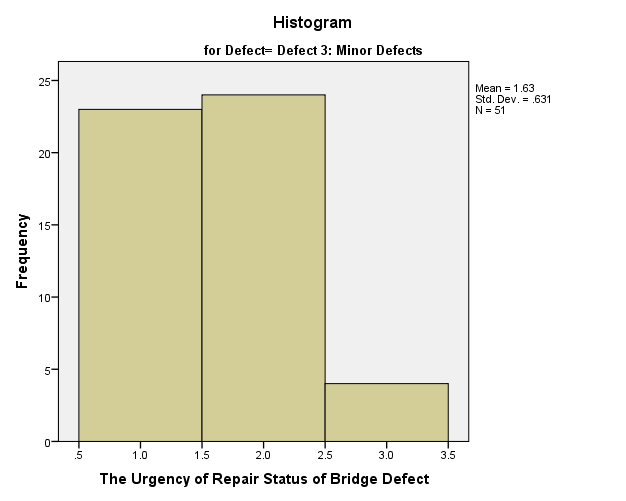
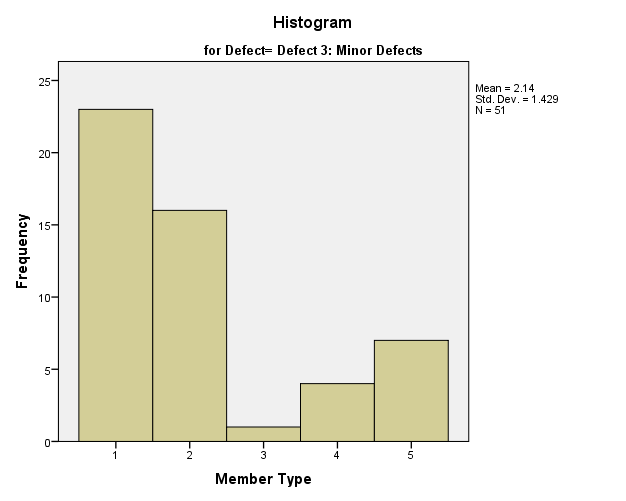
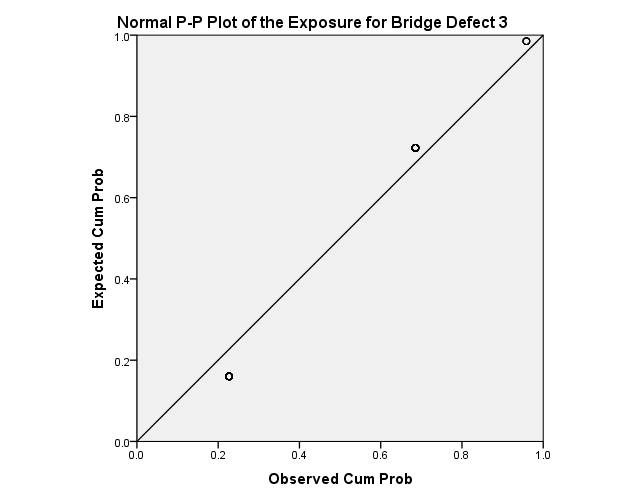
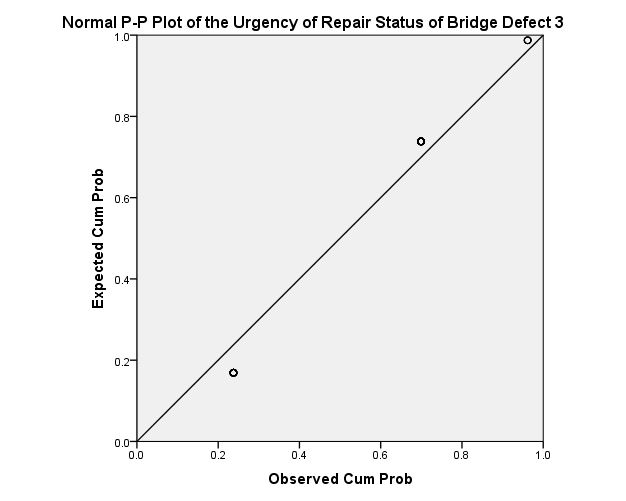
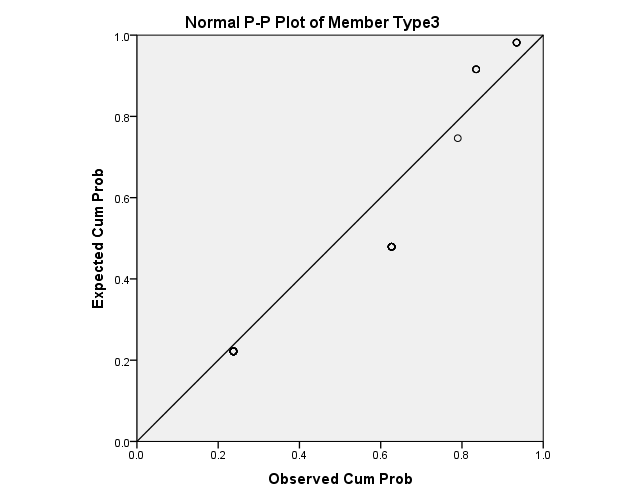
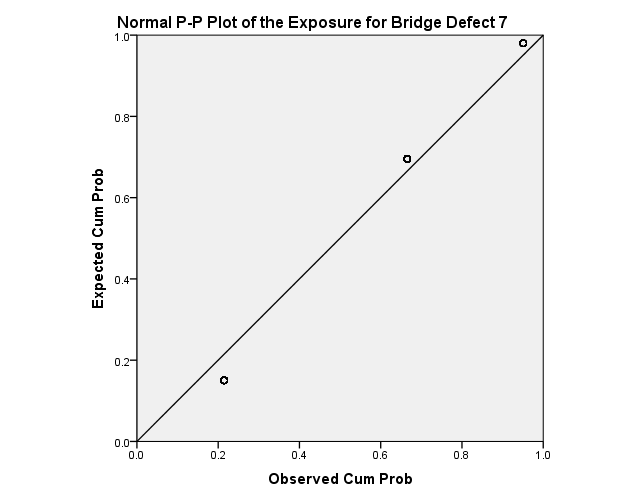
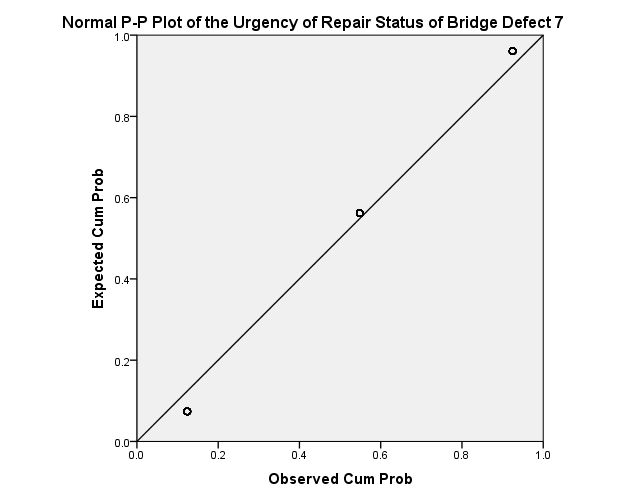
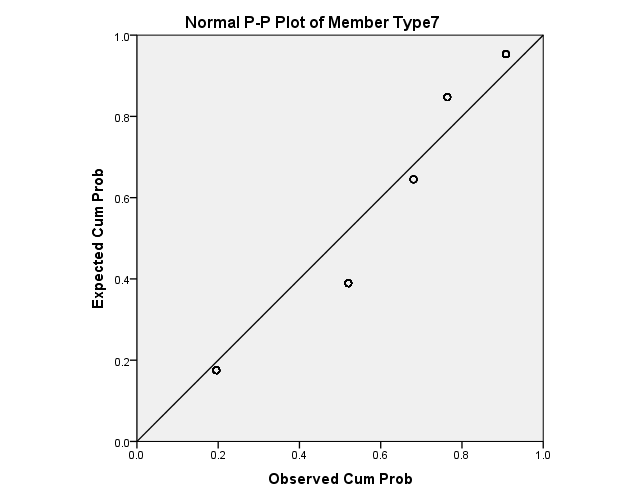
Histograms for minor defects indicate that mild, moderate, and severe exposures are the common causes of minor defects. The urgency of repair is usually insignificant, serviceable, and rarely very significant for minor defects. The member type of defects are normally flexural and compression whereas parapet and others are rare. The descriptive statistics for minor defects indicates that the exposure condition has a range of 2 (M = 1.63, SD = 0.631), urgency of repair has a range of 2 (M = 1.60, SD = 0.627), and member type has a range of 4 (M = 2.07, SD = 1.399). Probability distribution plot of P-P plot indicates that the data of exposure condition, the urgency of repair, and member type follow the normal distribution. The mean exposure condition (M = 1.63) and the mean of the urgency of repair (M = 1.63) are within the 95% confidence intervals of 1.45 to 1.80. The member type mean of 2.14 is within the 95% confidence interval of 1.74 to 2.54.
Minor Spalling
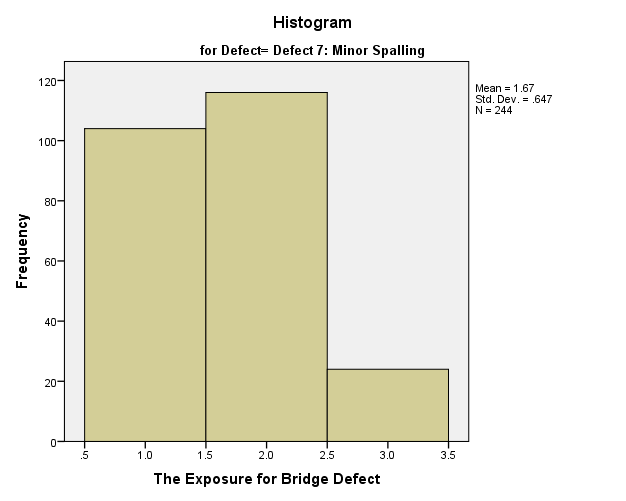
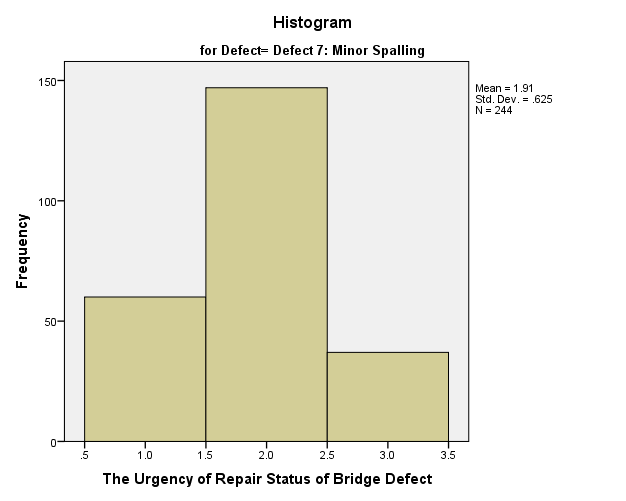
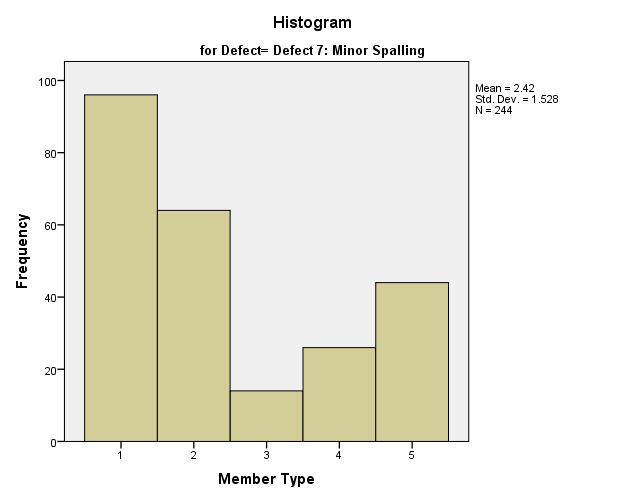
In the defects of minor spalling, mild, moderate, and severe conditions are the common causes. The most common form of urgency repair for minor spalling is serviceable. The member types are flexural, compression, others, parapet, and joint, according to the order of frequency. The descriptive statistics for minor spalling shows that the exposure condition has a range of 2 (M = 1.67, SD = 0.647), urgency of repair has a range of 2 (M = 1.60, SD = 0.624), and member type has a range of 4 (M = 2.07, SD = 1.531). The P-P plot indicates that the distribution of data of exposure condition, urgency of repair, and member type follows the normal distribution. The mean exposure condition (M = 1.67) is within the 95% confidence interval of 1.59 to 1.75 whereas the mean of the urgency of repair (M = 1.91) is within the 95% confidence interval of 1.83 to 1.98. The member type mean of 2.42 is within the 95% confidence interval of 2.23 to 2.61.
Major Deterioration
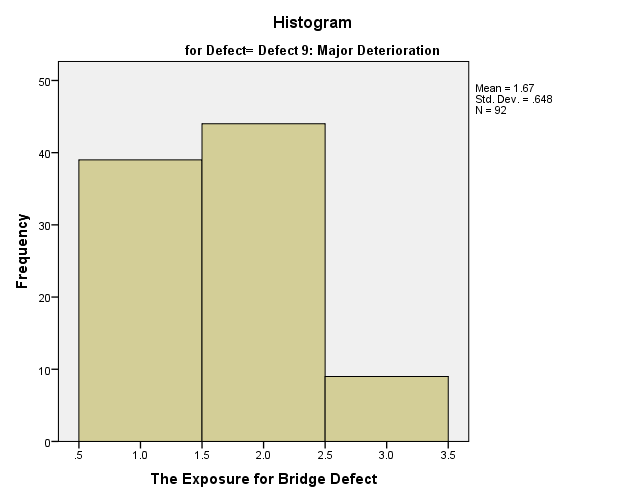
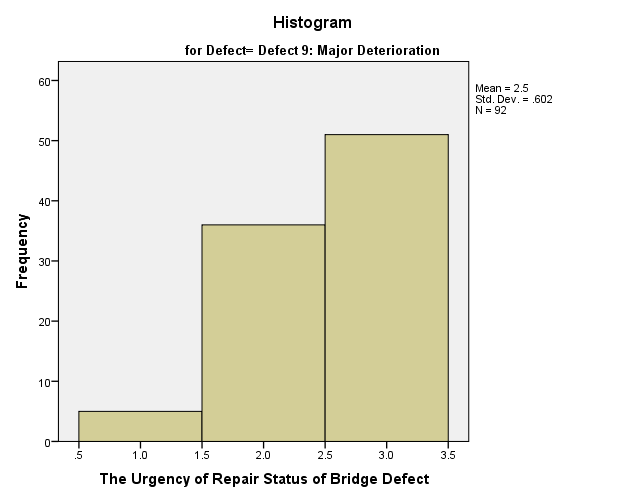
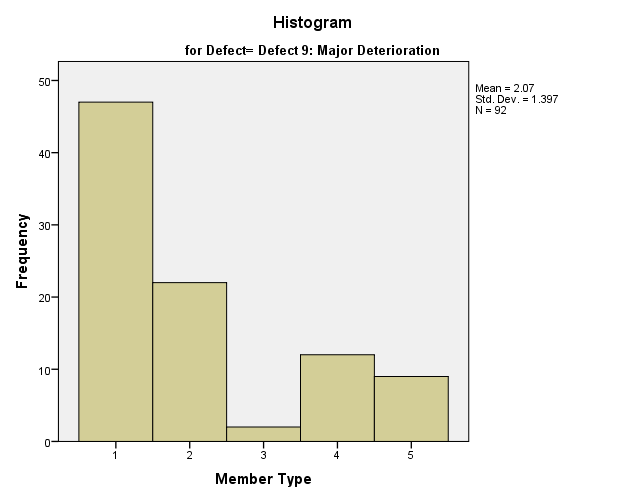
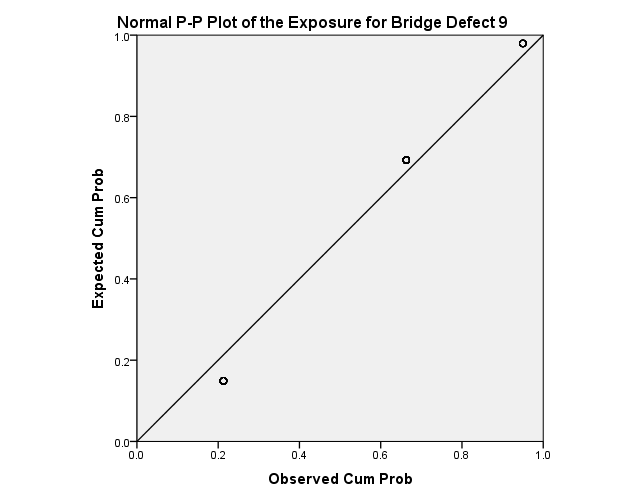
Mild, moderate, and severe exposure conditions are the causes of a major deterioration in bridges. The urgency of repair of major deteriorations is very significant and serviceable. Flexural and compression are two types of defects that occur in major deterioration. The descriptive statistics for major deterioration indicates that the exposure condition has a range of 2 (M = 1.67, SD = 0.648), urgency of repair has a range of 2 (M = 2.50, SD = 0.602), and member type has a range of 4 (M = 2.07, SD = 1.397). The mean exposure condition (M = 1.67) is within the 95% confidence interval of 1.54 to 1.81 while the urgency of repair (M = 2.50) is within the 95% confidence intervals of 2.38 to 2.62. The member type mean of 2.07 is within the 95% confidence interval of 1.78 to 2.35.
Hypothesis Testing
Z-Test
The analysis of z-scores of the exposure condition, urgency of repair, and member type offers insights regarding the independence of data. The z-test rejects the null hypothesis and shows that the urgency of repair is dependent on the defect number (p = 0.000). However, the z-test fails to reject the null hypothesis indicating that the exposure condition and member type are independent of defect numbers.
T-Test
The T-test shows a similar pattern of z-test for it indicates that the urgency of repair is dependent while exposure condition and member type are independent of defect numbers. In essence, the t-test rejects the null hypothesis of independence and indicates that the urgency of repair is dependent on defect number, F(2) = 44.525, p = 0.000. Nevertheless, the test fails to reject null hypotheses of exposure condition and member type (p > 0.05).
Chi-Square Test
Chi-square test rejects the null hypothesis for it shows that there is a statistically significant association between minor spalling and defect number, (4) = 86.764, p = 0.000. However, the chi-square test fails to reject the null hypothesis, which means that exposure condition and member type have no statistically significant association with defect number.
Linear Regression Analysis
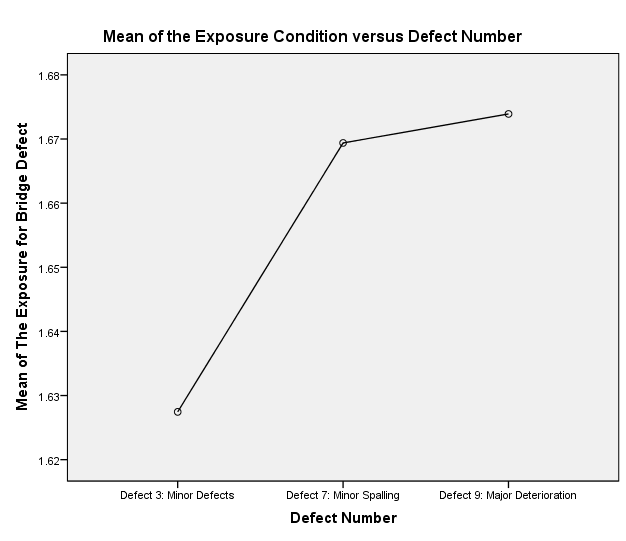
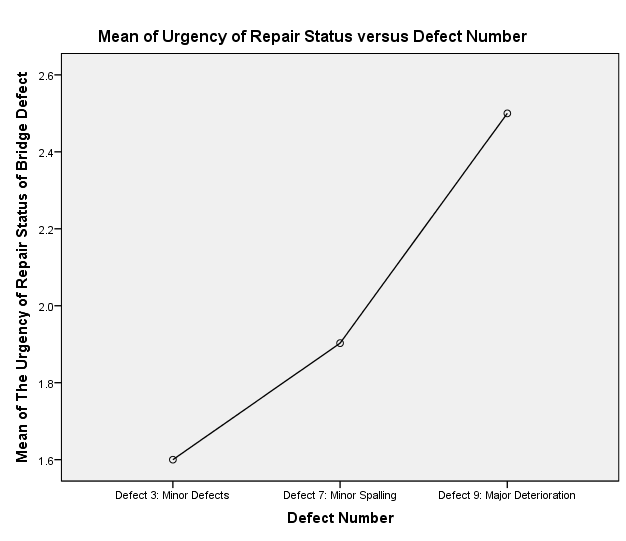
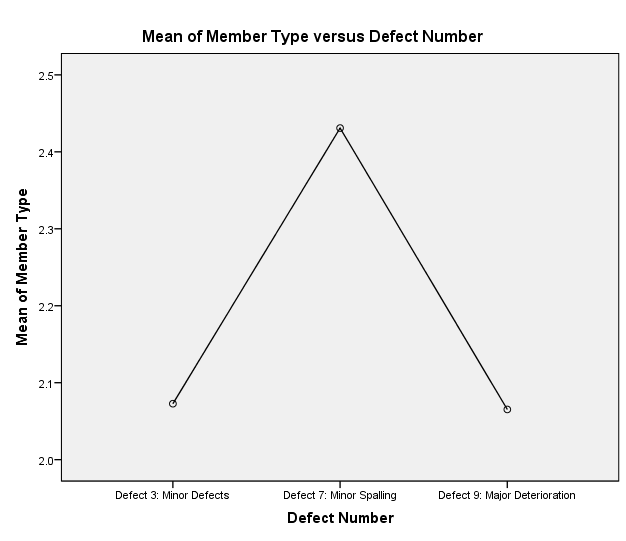
The mean plots show that exposure conditions and the urgency of repair have positive relationships with defect numbers while member type and defect number have no apparent relationship. Narwaria and Tiwari (2016) explain that the expansion of classification standards is essential to enhance the effective and timely maintenance of structures. Linear regression analysis shows that the urgency of repair is a statistically significant predictor (p = 0.000) because it has a moderate relationship (R = 0.418) and explains 17.5% of the variation in defect number. These findings are consistent with that of Lahdensivu et al. (2013), which indicates that the urgency of repair is an issue in construction because it results in the wastage of resources due to early and unnecessary repairs. A unit increase in the urgency of repair results in 0.37 units increases in the defect number. The exposure condition has a very weak relationship (R = 0.018) and does not explain any variation in defect number. Similarly, member type has a very weak relationship (R = 0.025) and explains 0.1% of the variation in the defect number.
Conclusion
Concrete defect analysis offers invaluable findings, which indicate the relationship between exposure conditions, the urgency of repair, and member type and the defect number. Histograms and probability distribution plots show that the data of exposure, the urgency of repair, and member type follows the normal distribution, and thus, meet the assumptions of z-test, chi-square test, t-test, and linear regression analysis. The tests of independence reveal that the urgency of repair is the only variable that has a statistically significant association with the defect number. Moreover, regression analysis reveals that the urgency of repair is a statistically significant predictor for it explains 17.5% of the variation in the defect number.
Reference List
Estokov, A., Harbulakova, A., Luptakova, A & Stevulova, N. 2012, ‘study of the deterioration of concrete influenced by biogenic sulfate attack.’ Porcedia Engineering, vol. 42, no. 1, pp. 1731-1738.
Gollu, K, Allam, D & Erla, S. 2016, ‘Causes of concrete failure.’ International Journal of Advanced technology in Engineering and Science, vol. 4, no. 4, pp. 198-206.
Lahdensivu, J, Varjonen, S., Pakkala, T. & Kollo, A 2013, ‘Systematic conditions assessment of concrete facades and balconies exposed to outdoor climate.’ International Journal of Sustainable Building Technology and Urban Development, vol. 4, no. 3, pp. 199-209.
Narwaria, R & Tiwari, A 2016, ‘Development of cracks in concrete, preventive measures, and treatment methods.’ International Research Journal of Engineering and Technology, vol. 3, no. 9, pp. 671-677.
Nepal, J & Chen, H 2015, ‘Assessment of concrete damage and strength degradation caused by reinforcement corrosion.’ Journal of Physics, vol. 628, no. 1, pp. 1-8.
Zhang, S, Dong, X, Zhang, H & Deng M 2014, ‘Research on Deterioration Mechanism of Concrete Materials in an Actual Structure,’ Advances in Materials Science and Engineering, vol. 2014, no. 306459, pp. 1-6.