Introduction
Consumer research is an aspect of market research that focuses on the consumers’ inclinations, motivations, and purchasing behaviors through various methods (Czitrom and Spagon 17). Effective consumer research requires data collection through various methods, such as, sample observation, online surveys, direct interviews, phone interactions, and secondary data (for instance, demographic statistics).
The importance of consumer research in marketing cannot be overemphasized because it provides business managers apposite information for brand development and distribution strategies. Although marketers and managers are aware of this importance, their inability to perform consumer research makes it difficult for them to identify customers’ preferences (Montgomery 33).
Consumer research is important to business developers because it helps them identify an appropriate target market. A product that is released into the market without detailed consumer research is likely to fail. With consumer research, businesses can develop and release products that target the right customers and respond to the factors that influence peoples’ purchasing decision (Birkes 81).
Pricing is a common variable that influences consumers’ decisions. Thus, consumer research projects identify and respond to people’s income (Chatfield 43). The current paper is an analysis of consumer characteristics that tend to be used to predict the amount charged by credit card users.
Methodology
As earlier stated, the aim of this research investigated how consumer characteristics influenced the amount charged on their credit cards. Three variables, namely, annual income, household size, and annual credit card charges were collected from a sample of 50 consumers.
The influences of annual income and household size on annual credit card charges were analyzed respectively, and the better predictor was identified. An estimated regression equation was developed using annual income and household size as the independent variables and credit card charges as the dependent variables.
Statistic Techniques
Descriptive statistics and regression equations were used to analyze the data generated from the above methodology. The descriptive statistics and regression equations summarized the data while the regression equations tested the relationship between the three variables.
Although regression equations can expose the inferential relationship between the variables, they do not provide established theories since other factors may affect data trends (Draper 92). Therefore, model diagnostics and goodness of fit tests were used to determine the validity of the findings and the generalizability of the research analysis.
Data Analysis using SPSS
Results
Descriptive Statistics using SPSS
Descriptive statistics are a group of illustrational numbers that provide summary to a dataset and represent part, or all, of the participants. Table 1 comprises the descriptive statistics of the dataset.
The descriptive statistics in Table 1 comprise the mean, median, mode, and sum of the values in the dataset. The mean represents the average of the scores for a specific variable (Fox 55). Table 1 shows that the mean values for income, household size, and amount charged are $43.48, 3.42, and $3964.06 respectively.
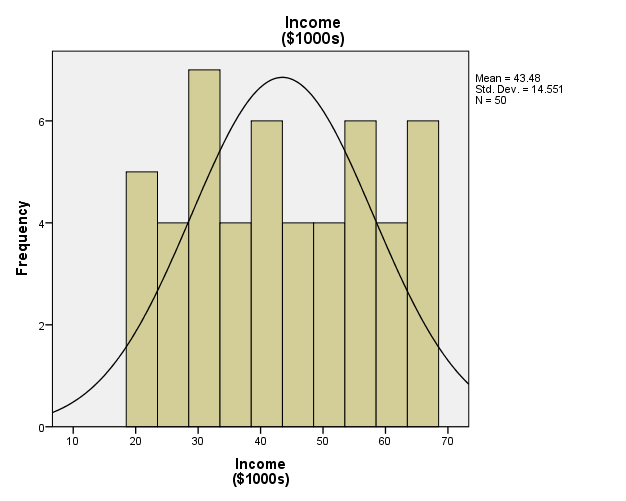
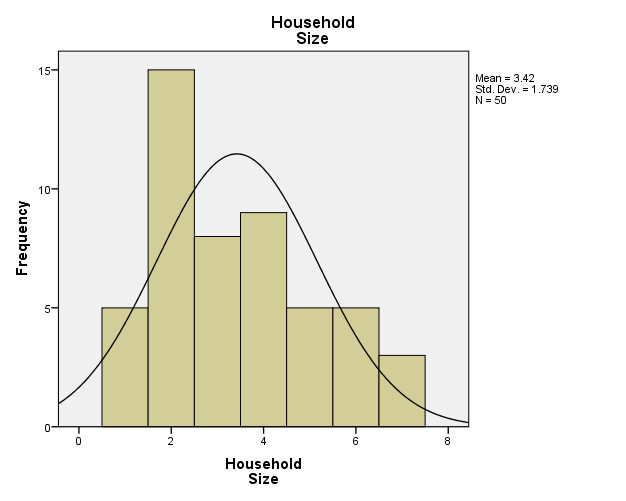
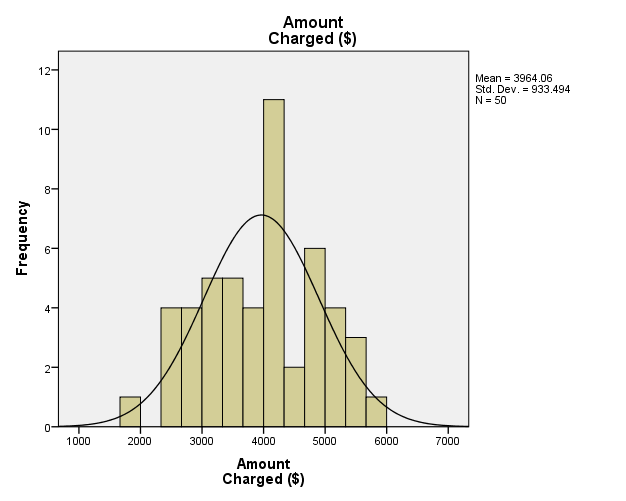
The median is the central value, while the mode represents the most recurring value. The mode values show that most participants have an income of $30000 annually and a family size of two members. Figure 1, 2 and 3 are charts illustrating the frequencies of the each variable.


Estimated Regression Equations
Estimated regression equations are derived from linear regression analysis and are used to test the relationship between variables and predict the values of unknown variables. Two estimated regression equations were developed. The first estimation regression equation, which used annual income as the independent variable and household size as the dependent variable yielded the following results.
Table 2 shows the variables entered/removed and shows that no variable was dropped by SPSS.
Table 4 summarizes the analysis of variance.
Table 4 shows the results for the analysis of variance, which tests the significance of the factors. Since the sig. value is less than 0.01, the relation between the variables is statistically significant up to 1%.
The coefficient estimates shown in Table 5 are analyzed from the ANOVA table. The coefficient of income shows that every increase in income by $1 causes the amount charged to increase by $40.480
The second estimated regression equation, which used annual income and household size as the independent variable and dependent variables respectively, yielded the following results.
Table 6 shows that no variable was dropped by SPSS.
Table 8 is the analysis of variance and shows that the relationship between the variables is significant up to 1%.
Table 9 provides the unstandardized coefficients of relation between the variables.
The values of B indicate that every increase in household members by 1 person causes the amount charged to increase by $404.128.
Estimated Equations for Annual Income and Household Size as Independent Variables
The results of the statistical analysis in the previous section are sufficient to develop an equation for estimating the increase in amount charged for every increase in income and household membership. However, a regression analysis that combines the tow independent variables will produce varying prediction coefficients. The following tables are the results derived by performing a linear regression in SPSS using the two independent variables.
Table 10: Variables Entered/Removed
Table 11: Model Summary
Table 12: ANOVA
Table 13: Coefficients
The values of B for “household size” and “income” are 356.396 and 33.133 respectively. Therefore, every increase in household members by 1 person causes the amount charged to increase by $356.296 and every $1000 increase in income causes the amount charged on the credit card to increase by $33.133. The following equations are developed from the results of the linear regression analysis:
Predicted Credit-Card Charge for four-person household with an annual income of 45,000Euros
The twelfth participant in the dataset has an income of 48000 Euros and a household of four people. If the person were to earn 45000 Euro, then the person’s credit card charge will reduce by (356.296*3) Euros. The following are the values for the twelfth participant in the dataset.
Income = 48000
Household = 4
Amount Charged = 4,219
Therefore the amount charged for an income of 45000 Euros = 4,219 – (356.296*3) = 4,219 – 1068.888 = 3150 Euros.
Other Possible Independent Variables
Income and household size are not the only variables that influence annual amount charged on credit cards. Spending habits and location may contribute to the credit card charges incurred by members of the population. The amount charged in credit cards is related to people’s locations and their spending habits because a charge is applied each time the card is used. Due to their shopping habits, people living in urbanized areas may be charged higher than those in sub-urban areas.
Conclusion
Due to the importance of consumer research for productivity, business organizations employ diverse methods to identify and analyze market data. Consumer research is a necessity for small and big businesses because it helps them effectively position their products in competitive markets.
The aim of the paper was to analyze consumer characteristics that predict the annual amount charged by credit card companies. Descriptive and regression analysis of the provided dataset showed that income and household size significantly influence the annual amount charged on credit cards.
Recommendation
The results of the linear regression are applicable for estimating the annual charges on credit cards when “income” and household size is known. Although the findings of the research are conclusive and indicate the influence of income and household size on the annual charges incurred on credit cards, important variables were not considered during the study. It is recommended that future studies investigate the influence of other variables on the annual charges incurred on credit cards.
Works Cited
Birkes, David. Alternative Methods of Regression. NY: John Wiley & Sons, 2012. Print.
Chatfield, Calvin. Calculating Interval Forecasts. NY: John Wiley & Sons, 2004. Print.
Czitrom, Veronica and Spagon, Patrick. Statistical Case Studies for Industrial Process Improvement. CA: SIAM, 1997. Print.
Draper, Noel. Applied Regression Analysis. NY: John Wiley & Sons, 2013. Print.
Fox, Josh. Applied Regression Analysis, Linear Models and Related Methods. NY: John Wiley & Sons, 2000. Print.
Montgomery, Carl. Statistical Quality Control: A Modern Introduction. NY: John Wiley & Sons, 2012. Print.