Correlation is a statistical analysis tool that is used to ascertain the relationships between two linear variables. A correlation can only be effective when two or more variable are compared side by side; whereby, their strengths are compared to determine whether their relationship is correlated or non correlated (Ferguson, 1959, 1).
Correlation can be established in two different ways, first using the graphical method; whereby, the two variables are plotted on a graph and a line of best fit is drawn to assess whether there is dispersion from the line or using the spearman’s correlation coefficient method.
In the former method, the closer they are to the line, the more correlated they are and the more dispersed from the line, the less correlated they are (Johnston &Yen, 2009, pp. 1-4) and Rummel, 1976, p 1.
Correlation will normally range from -1 to 1 and r= is used, which is independent from either the x or y variable to signify the level of relationship (Ferguson, 1959, Johnston p. 1).
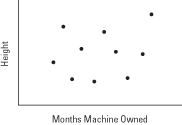
When correlation is exactly 0, it signifies a lack of linear relationship between the two variable; hence, the given sets of data will be said to be uncorrelated. As you can see in the example below the two variables as seen to be uncorrelated.
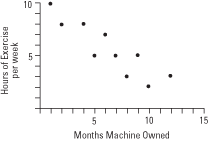
When the correlation is less than 0, we say the two variable have a negative correlation, since when the variable X increases, the Y variable decreases, showing that r=-1.
A negative correlation between two sets of values can be shown by the graphical representation below.
Lastly, when the relationship is greater than 0, we say the two variants are positively correlated because as X variable increases, the Y variable also increases too in perfect union (Shaughnessy and Zechmeister, 2009, pp.1-10 and Aggarwal, 1986, pp. 2-14).
The data above is plotted in the graph below by assignment the vertical axis (x) the dependent variable, which is the no of umbrellas sold and the horizontal axis (y) which is the independent variable to the rainy days.
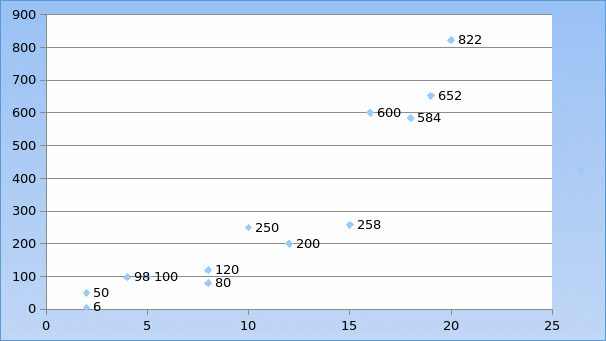
In the example above we can comfortably say there is a correlation of positive between the two variables. This means the sale of umbrellas is determined by the number rainy days in any single month.
The other method used to determine correlation is the Pearson’s Correlation Coefficient formula method, which uses the formulae below to derive accurate numbers of the correlation of two or more variables (Shaughnessy, Zechmeister & Zechmeister, 2009, pp. 2-9).
In order to use to solve the following equation, additional information is required as computed below.
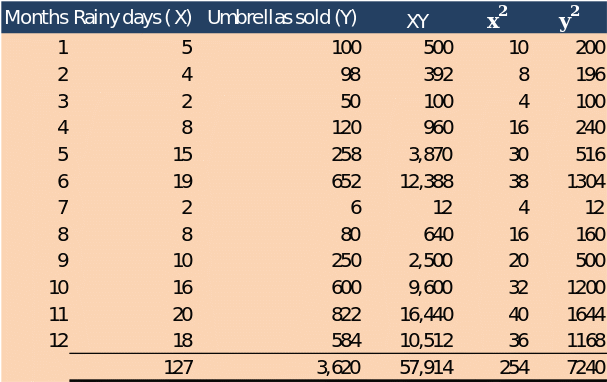
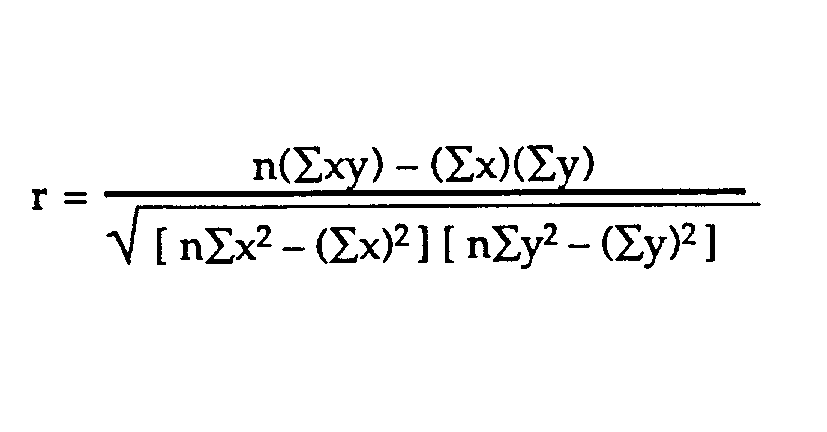
Formular (a)X
To get the Pearson’s Correlation Coefficient, r, we substitute the above values in formular (a)
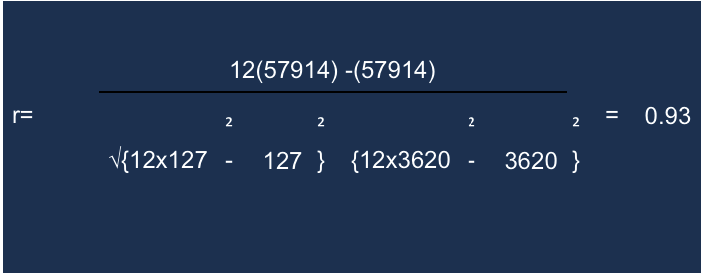
You cannot just by calculating the correlation deduce that on a variable will always react in a certain way when used in conjunction with the other variable. In certain instances, other underlying courses influence the variable, so utmost care has to be exercised here.
Advantages of the Pearson’s Correlation Coefficient formula
- This method is easy to use and interpret, because all it requires is the basic statistical computational skills.
- It simplifies the comparison of two dimensional images to a single scalar and it does not change with the linear transformation of any two variables, more so for two closely related variables.
Disadvantages
- This method only helps to ascertain the nature of linear relationships between two variables; hence, in most cases, when the relationship is not linear, then the results may be inaccurate.
- Results from this method can be hard to interpret and ambiguous more so when finding the correlation between unrelated phenomena, for example the size of shoes and intelligence.
- When using this method, the obtained “r” value cannot be used to explain the cause and effect relationship, because the only thing you can deduce from the value of “r” is whether there is a relationship between two variables. (Johnston &Yen, 2009, pp. 5-9).
References
Aggarwal, Y. P. (1986). Statistical Methods: Concepts, Application and Computation. New York City: Sterling Publishers.
Rummel, R. J. (1976). Understanding Correlation. Honolulu: Department of Political Science, University of Hawaii.
Shaughnessy, J. J., Zechmeister, E. B., & Zechmeister, J. S. (2009). Research methods in psychology (8th Ed.). New York, NY: McGraw Hill.
Yen, K. E. & Johnson, R.G. The ineffectiveness of the Correlation Coefficient for Image comparisons. New Mexico: Los Alamos National Laboratory.