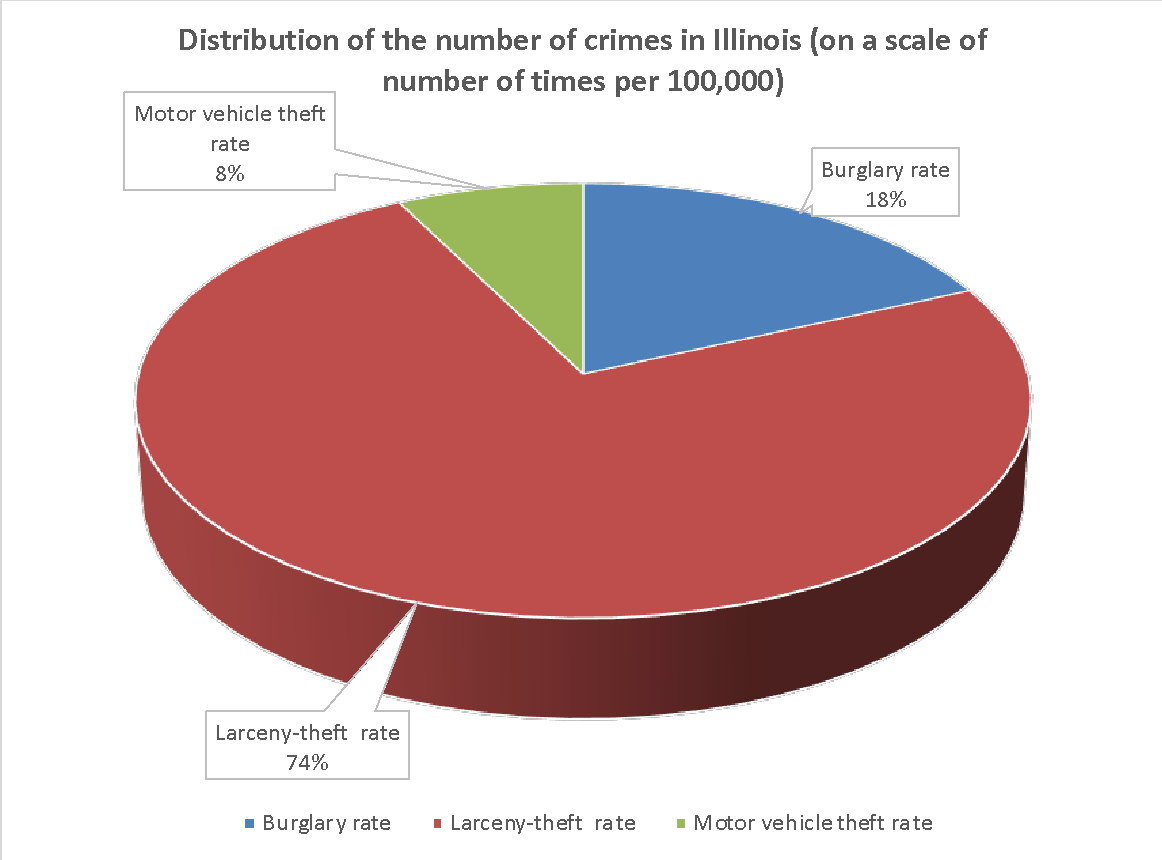
The subject of this analysis report is the crime situation in the state of Illinois with respect to property crimes. Reference to Figure 1 reports that the highest number of crimes in terms of frequency of occurrence per 100,000 for the state is maximized for the Larceny-theft rate. This is 1,518.6 out of 100,000, or 74% of the state’s total property crime rate. At the same time, the crime rate for motor vehicle theft is the lowest, at 8% or 155.5 per 100,000. In other words, state residents were more likely to be the targets of property burglaries than whole motor vehicle thefts or burglaries.

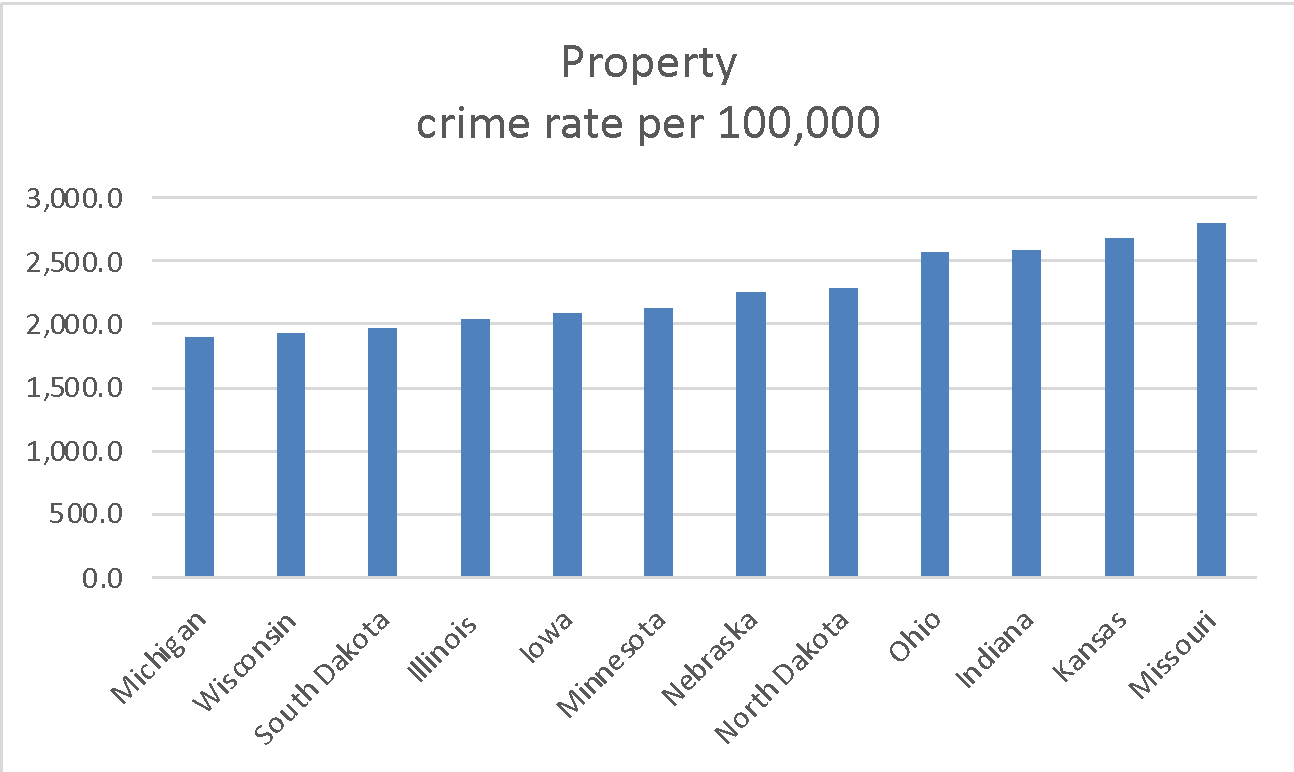
Illinois is part of the Midwest Region, which has a total of twelve states: Michigan, Wisconsin, South Dakota, Illinois, Iowa, Minnesota, Nebraska, North Dakota, Ohio, Indiana, Kansas, and Missouri. These twelve states were listed in this order for a reason: from Michigan to Missouri, there has been a gradual increase in the rate of total property crime, as shown in Figure 2. Notably, Illinois is closer to the left edge of this distribution, meaning that it is true to say that this state does not have the highest (nor the lowest) rate of property crime in the entire Midwest.

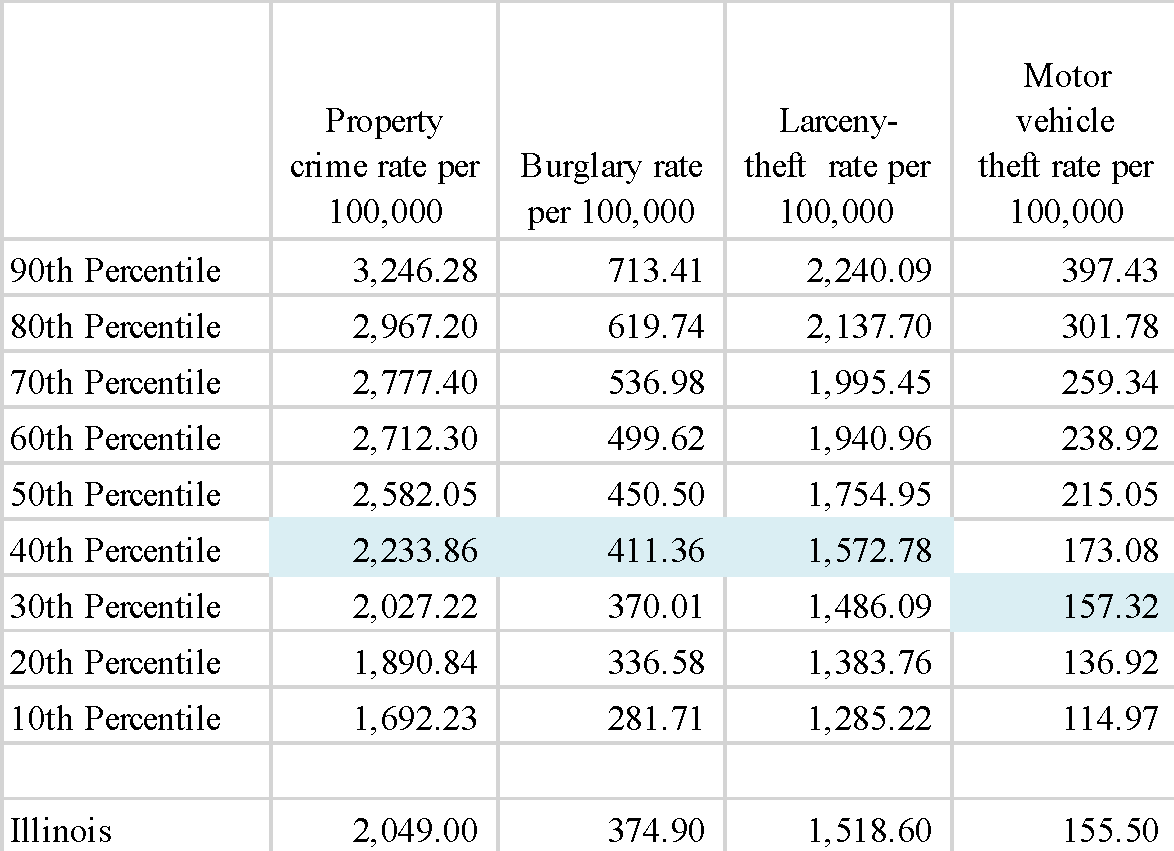
A percentile table was also constructed for the data (Figure 3), showing the dynamics of the distribution of the number of crimes committed among all states. The results should be interpreted as follows: if states had a total crime count greater than 3246.28, they were worse than 90% of the other states, meaning they had significantly higher crime rates. For Illinois, it was calculated that for almost every type of crime except auto theft, only 40% of the other states were better than the state. In the case of auto theft, the state was in the top 30 percent, meaning it had a higher crime rate than thirty percent of the other states.

Multiple regression analyses were also conducted for each crime type (three total) as a function of various independent factors (four total). These influence factors include the divorce rate, poverty rate, rural population rate, and youth population rate. For each of the analyses, the regression model was significant because the corresponding p-values were below the critical alpha level (.05). For the Burglary rate, only the number of the poor population was a significant predictor: the poorer the population, the higher the number of these crimes. The same was found for the Larceny-theft rate. For the motor vehicle theft rate, the significant predictors were not only the level of poor population, which had the same effect on the dependent variable, but also the number of the rural population. For the second, the pattern was the opposite: the more significant the rural population, the lower the number of personal vehicle thefts. This analysis needs to be supplemented, for example, by examining the effects of variables such as the average age of the population, the number of ex-convicts, the distribution of ethnic composition, and the presence of higher education.