Cash Flow Dashboard

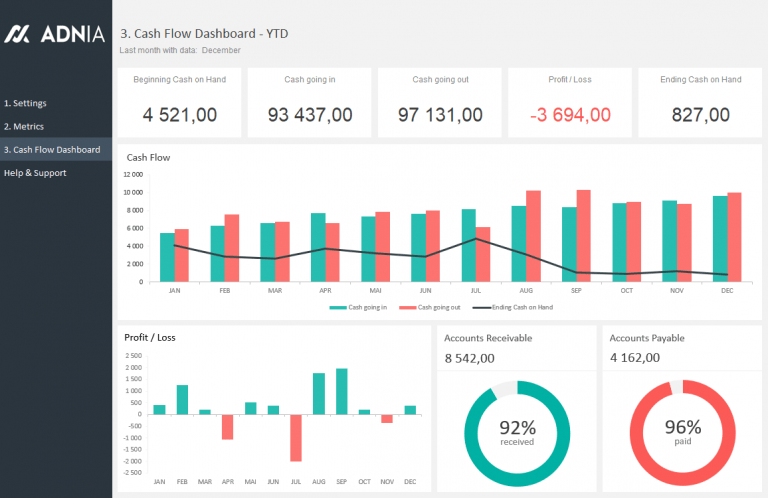
The cash flow dashboard provides an organization’s management team with a clear way to observe the money movement in a business. The system allows the firm to continuously spot areas where they overspend and places users need to adjust to attain the maximum operation. The dashboard should show the business’s per day income and accounts payable. This will make it easier for the team in charge or system’s users to observe the firm’s cash transactions daily.
The dashboard indicates the amount of stock available in the company, which is useful, especially to big organizations that handle large productions as management can quickly detect the capacity of goods they have produced to either reduce or increase the manufacturing rate. Money at hand is a column that projects the company’s cash balance. The management group will be able to see the fall below the minimum required and thus signal for effective measures. The dashboard must have the details of the gains the organization makes in every operation it undertakes. The profit column allows the examiners to evaluate the firm’s performance ratio; hence, decisions such as remaining operating or quitting the market can be determined as per the value of the revenue.
There are several ways that the creators can improve the cash flow dashboard. For a better informing system, developers should provide current and live updates on cash transactions from the data collected for real-time and on-demand analysis (Sarikaya et al. 685). Any change made should be reflected immediately for an accurate viewing; this will produce reliable information about the company’s financial status (Sarikaya et al. 685). The dashboard can also include stickers and icons to make it possible for the users to leave marks on the respective sheets for later reference and proper analysis, especially on trends that involve graphs.
Sales Dashboard

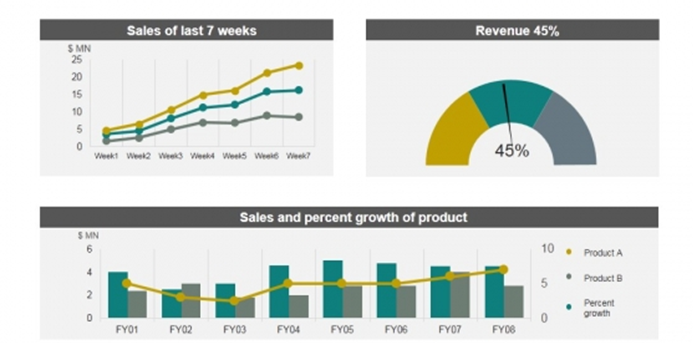
This tool provides a platform where the users can view, control, or improve the number of products they take to consumers. Managers can identify the market trends and give a future prediction to boost the returns from sales activities. The dashboard has a forecast report, which shows the relationship between the previous sales and the future performance. The manager will see and estimate the time spent to achieve the outcome by every sales agent. It includes a speedometer that easily shows the rate at which general sales activities are performed. The data offers real-time analysis of the definite sales against the firm’s projection. The dashboard has the biggest sales pipeline that converts unprocessed numbers into appealing images that allow salespersons to identify their progress and make possible changes as the need arises. There is an actionable leaderboard that promotes accountability and effectiveness in sales while enhancing transparency in the activities done by the sales agent.
Several steps can be taken to improve the sales dashboard shown above. For instance, the dashboard ought to have various chart types as this will make it easier for the analysts to add trends to the data for a simple and quick investigation (Sarikaya et al. 684). Their operating live-time must be improved to become effective or be accessible every moment to avoid loss of stored information. Business enterprises should have simplistic but fully developed dashboard systems to enable the various departmental heads to monitor and analyze the respective divisions’ overall performance for effective productivity and organizational growth.
Work Cited
Sarikaya, Alper, et al. “What Do We Talk about When We Talk about Dashboards?” IEEE Transactions on Visualization and Computer Graphics, vol. 25, no. 1, 2019, pp. 682-692, Web.