Introduction
Demand and supply are the foundations of any economic analysis as the interaction of the two forms a market. The law of demand and supply works in opposite ways in the sense that, when the prices of commodities changes, demand and supply change in opposite direction holding other factors constant. The magnitude of change of demand and supply depends on the type of the commodity in question.
For instance, demand or supply of some commodities respond more than changes in price as compared to others. This brings us to the concept of elasticity of goods. In addition, it is not only price that affects demand and supply of goods, there are other factors that would affect the market such as changes in technology, taste and preferences, favorable climatic conditions and many other factors. This paper explores how various factors affect changes in demand and supply.
Event
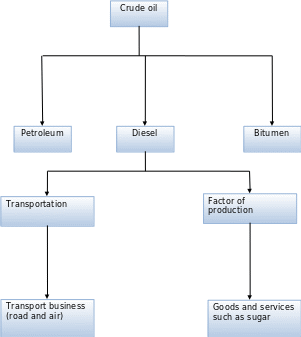
Various determinants of supply and demand often change. For instance, the price of goods can increase or decrease, the cost of production can increase, the price of the substitutes and complementary commodities can change, and consumers’ tastes and preferences can also change among others. Consider an event in which the price of crude oil increases to $150 per barrel. The change affects a number of commodities in the economy as shown in the diagram below.
Figure 1.0

Explanation
From figure 1.0, crude produces a number of products such as diesel and petroleum. Diesel is consumed as a factor of production and in transportation. The other products are used for various activities. For instance, bitumen is used in road construction. Diesel is used as a factor of production of good and services such as sugar.
An increase in the price of crude oil causes an increase in the price of diesel. Diesel is used in production of sugar. An increase in price of diesel results to an increase in cost of production. This causes a reduction in supply of sugar. Therefore, an increase in the price of crude oil affects the supply side of the economy.
Demand and supply of sugar before changes
Figure 1.1

Explanation
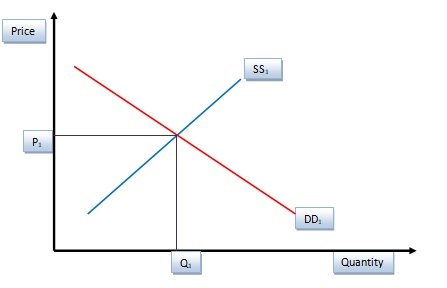
Figure 1.1 shows the initial equilibrium status of sugar before the changes in the price of crude oil. DD1 shows the demand curve while SS1 shows the supply curve. Intersection of the two curves yields the equilibrium. P1 is the equilibrium price while Q1 is the equilibrium quantity demanded and supplied.
Demand and supply of sugar after changes

Figure 1.2
Explanation
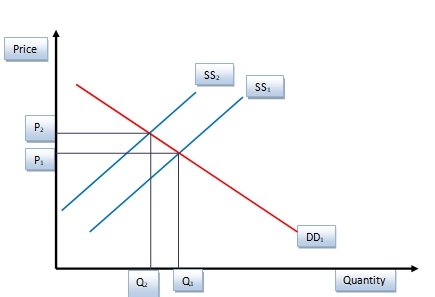
An increase in the price of crude oil to $150 per barrel causes an increase cost of factors of production. An increase in the cost of production leads to a decline in quantity of sugar supplied. The decline in supply is shown by an inward shift of the supply curve from SS1 to SS2. The shift makes the equilibrium position to change. Price increase from P1 to P2. The equilibrium quantity of sugar supplied decreases from Q1 to Q2.
Conclusion
The paper explains the effect of an increase in the price of crude oil on the economy. From the discussion above, it is apparent that an increase in the price of crude oil affects the supply side of the economy. It increases the cost of production of goods and services. This results to increase in price of goods and services and a decline in the equilibrium quantity.