SPSS Assignment
Exploratory Data Analysis


Table 1. Descriptive Statistics of LDL and HDL of Each Group.
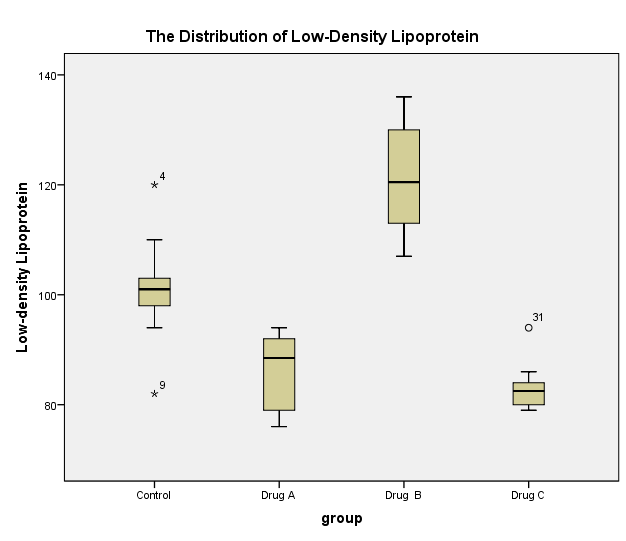
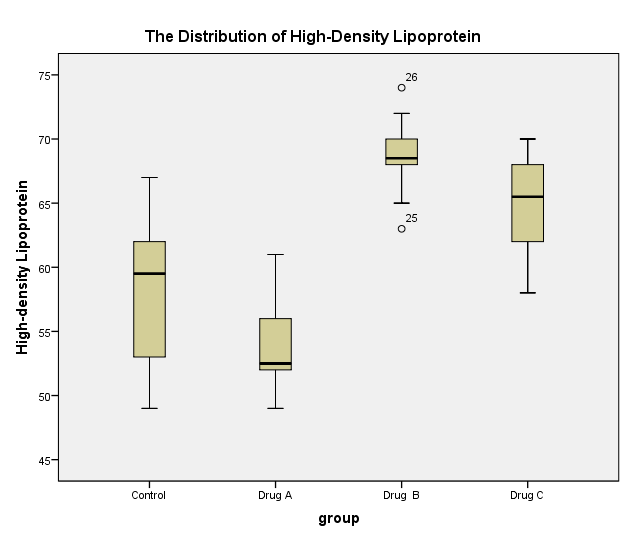
The distributions of low-density lipoprotein (LDL) and high-density lipoprotein (HDL) shows skewness and the presence of outliers. Figure 1 shows that LDL of the control group has two extreme outliers (82 and 120) whereas that of the group treated with drug C has a less extreme outlier (94). The distribution of LDL appears to violate the assumption of the normality in group A due to negative skew and group B owing to positive skew. The box plot (Figure 2) for HDL has less extreme outliers, 63 and 74, which distort the distribution of data. The control group and the treatment group C violates the assumption of normality caused by the negative skew of the distribution of HDL. In contrast, treatment groups A and B depict the existence of a positive skew in the distribution of HDL.
According to descriptive statistics (Table 1) , when compared to the level of LDL in the control group (M = 101.10, SD = 9.848), groups treated with drug A (M = 86.20, SD = 6.795) and C (M = 83.20, SD = 4.442) had lower mean levels of LDL, whereas the group treated with drug B had a higher mean level of LDL (M = 121.40, SD = 9.834). Similarly, the mean level of HDL in the group treated with drug B (M = 68.60, SD = 3.134) was higher while those of groups treated with drug A (M = 53.70, SD = 3.466) and drug C (M = 64.70, SD = 4.029) were lower than in the control group (M = 58.70, SD = 6.075).
MANOVA
Descriptive statistics (Table 2) point out that drug A (M = 86.20, SD =6.975) and drug C (M = 97.98, SD = 4.442) decreased LDL levels as expected, but drug B (M = 12.40, SD = 9.834) increased the LDL level an unexpectedly. Comparatively, drug B (M = 68.70, SD = 3.134) and drug C (M = 64.70, SD = 4.029) increased HDL levels as predicated, but drug A decreased the HDL level unpredictably.
Table 2. Descriptive Statistics.
The multivariate test (Table 3) reveals that drugs have statistically significant effect on cholesterol among patients, F(6,70) = 27.921, p = 0.000; Wilk’s Λ = 0.087. Comprehensive MANOVA outputs are in the appendix section.
Table 3. Multivariate Tests.
Table 4 indicates that drugs have statistically significant effect on both LDL (F(3,36) = 47.016, p = 0.000) and HDL (F(3,36) = 22.998, p = 0.000).
Table 4. Tests of Between-Subjects Effects.
Parameter estimates (Table 5) compare the levels of cholesterol to that of group C treated with the promising drug. The LDL level of the control group is statistically significantly higher than that of the group treated with drug C (b = 17.9, p = 0.000). Moreover, the HDL level of the control group is statistically significantly lower than that of the group treated with Drug C (b = -6.0, p = 0.04).
Table 5. Parameter Estimates.
Post Hoc Analysis
Post hoc analysis (Table 6) shows that the levels of both LDL and HDL are statistically significant between the control group and the treatment groups of drug A, drug B, and drug C (p < 0.05). Drug C, which is the most promising drug, reduced the level of LDL (M = 83.20) in a statistically significant way when compared to the control group (M = 101.10). Additionally, drug C increased the level of HDL (M = 64.70) in a statistically significant manner when compared to the control group (M = 58.70).
Table 6. Pairwise Comparisons.
Reflection
Scales of measurement, exploratory data analysis, and inferential statistics are the three most important areas of statistics that I have learned throughout the course. A scale of measurement determines the nature of statistical analyses because ordinal and nominal scales favor non-parametric tests, whereas interval and ratio scales are robust for parametric tests (Pallant, 2016). Exploratory data analysis summarizes data by establishing the existence of specific patterns and trends.
Moreover, exploratory data analysis aids in evaluating whether the distribution of data meets or violates applicable assumptions. Inferential statistics allow the determination of the statistical significance of noticeable trends and patterns of data.
The understanding of scales of measurement would greatly help me in formulating a questionnaire and collecting relevant data tailored to specific analyses in my dissertation work. The exploratory data analysis would enable me to describe trends and patterns in my dissertation, as well as assess if they meet the assumptions of inferential tests. Eventually, inferential statistics would assist in hypothesis testing and drawing of valid conclusions from my dissertation work.
Critical analysis of the course shows that it did not cover factor analysis, which is essential to the design and development of Likert scales. Fundamentally, factors analysis creates principal components and removes redundant variables.
Reference
Pallant, J. (2016). SPSS survival manual: A step-by-step guide to data analysis using SPSS (6th ed.). Maidenhead, England: Open University Press.